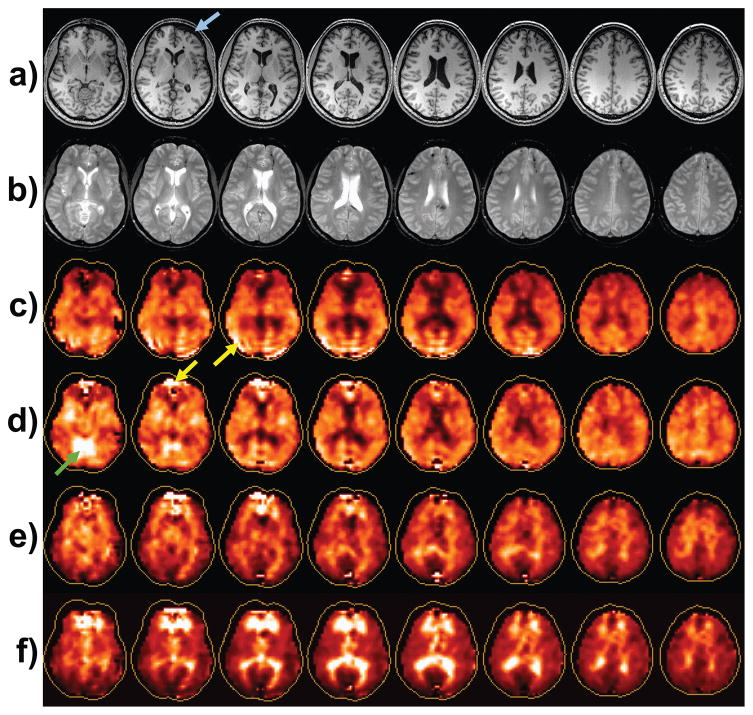
Figure 2.
Example images from the first time-point study: a) The T1-weighted MRI; b) the T2-weighted MRI; and maps for N-acetylaspartate (NAA) (c), choline (Cho) (d), creatine, and Cho/NAA (f). Arrows refer to features discussed in the text. The contour surrounding each metabolite map represents the full extent of the brain, which indicates that the edge voxels are not fully sampled by the volumetric spectroscopic image acquisition.

