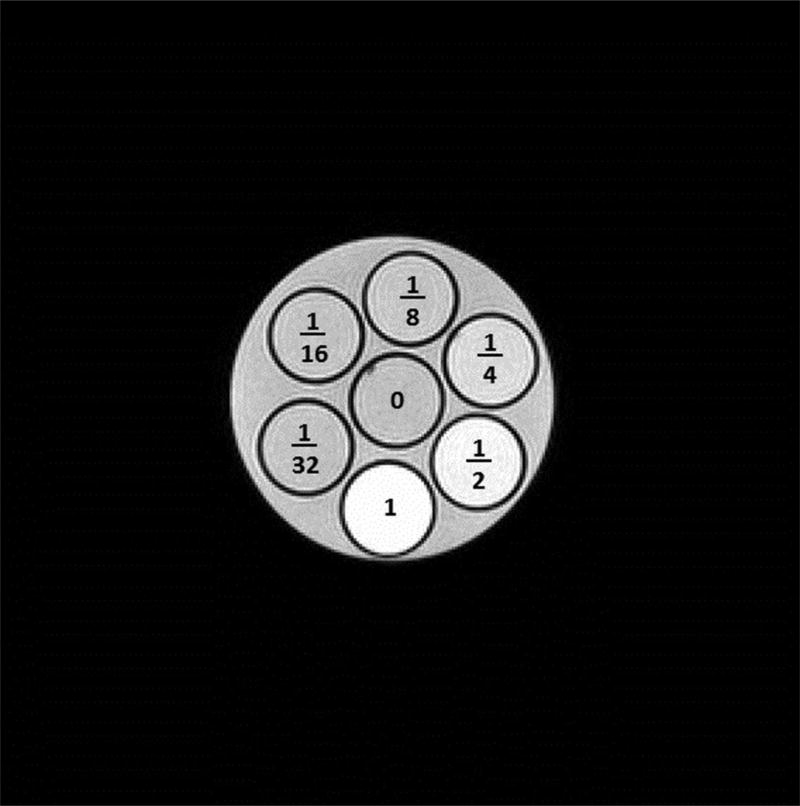
Fig 4.
A T1-weighted MR image of a dilution series of a phantom with different concentrations of an iodinated contrast agent (Omni-paque 350, GE Healthcare). The concentrations are labeled as follows: In the center, 0 for physiological saline solution, 1/32, 1/16, 1/8, 1/4, 1/2, and 1 for pure contrast agent. Brighter signal intensities in the vials with higher concentrations of the iodinated contract agent demonstrate T1 shortening effects.

