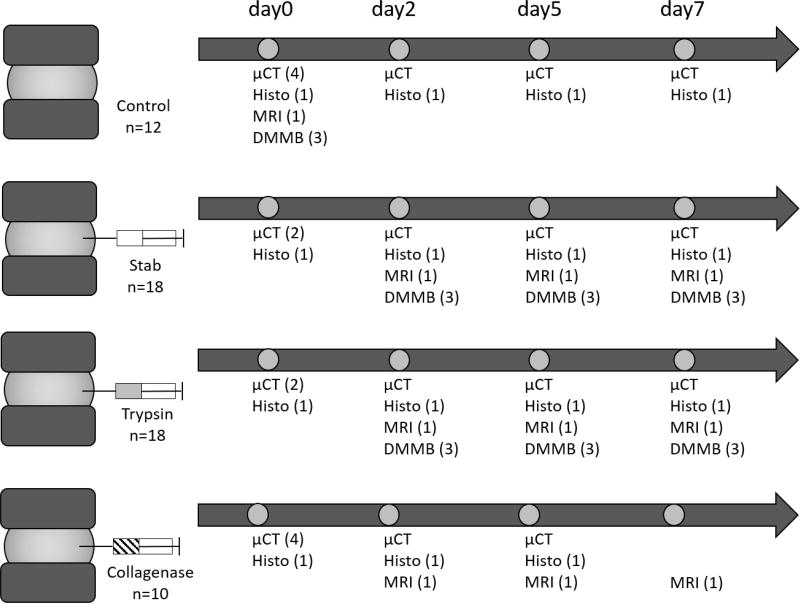
Figure 1.
Experimental design and workflow detailing the distribution of samples and imaging and assay modalities used. A total of 44 rat FSUs were used in this study with n = 10–12 per treatment group. µCT = contrast-enhanced microCT using Ioversol; Histo= histology by Safranin-O/Fast Green; MRI = Magnetic resonance imaging; DMMB = Dimethylmethylene Blue Assay.

