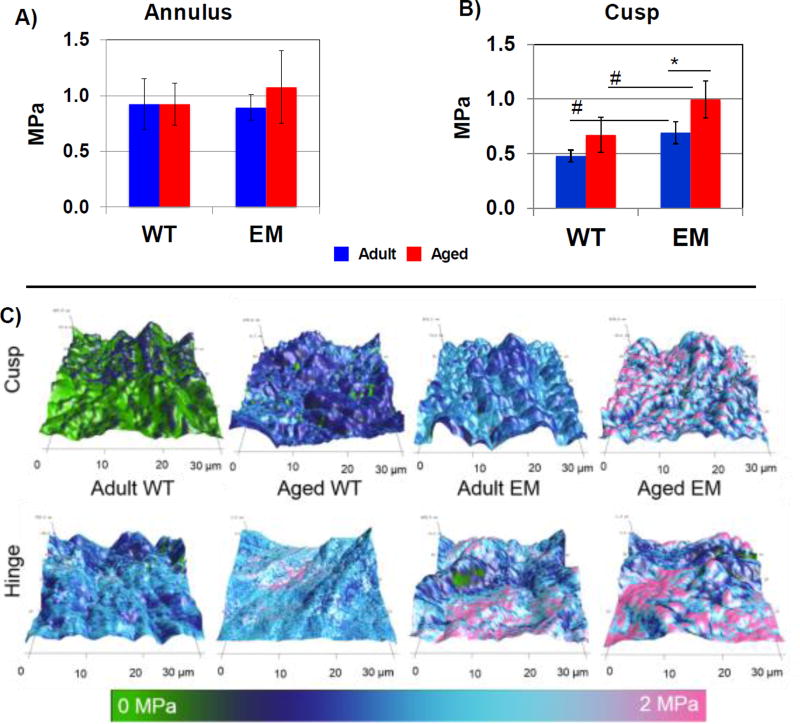
Figure 2. Determination of mechanical stiffness by genotype and age using atomic force microscopy.
AFM of AV cusp cross sections (30×30 µm2 measurement areas). A) Annulus region did not show a significant difference in microscale cross sectional measurements. B) AFM showed a significant increase in microenvironmental cusp stiffness between WT and Emilin1−/− at 4 months and 12 months, and when comparing Emilin1−/− mice at 4 months and 12-months. C) AFM topography of 30×30 µm cross sections, where z-axis shows thickness distribution, and color represents stiffness distribution used to calculate the average values presented in (B). Significant differences were determined using one-way ANOVA p-value ≤ 0.01. Asterisks denote significant differences when comparing ages; Hashtags denote significant differences when comparing genotypes.

