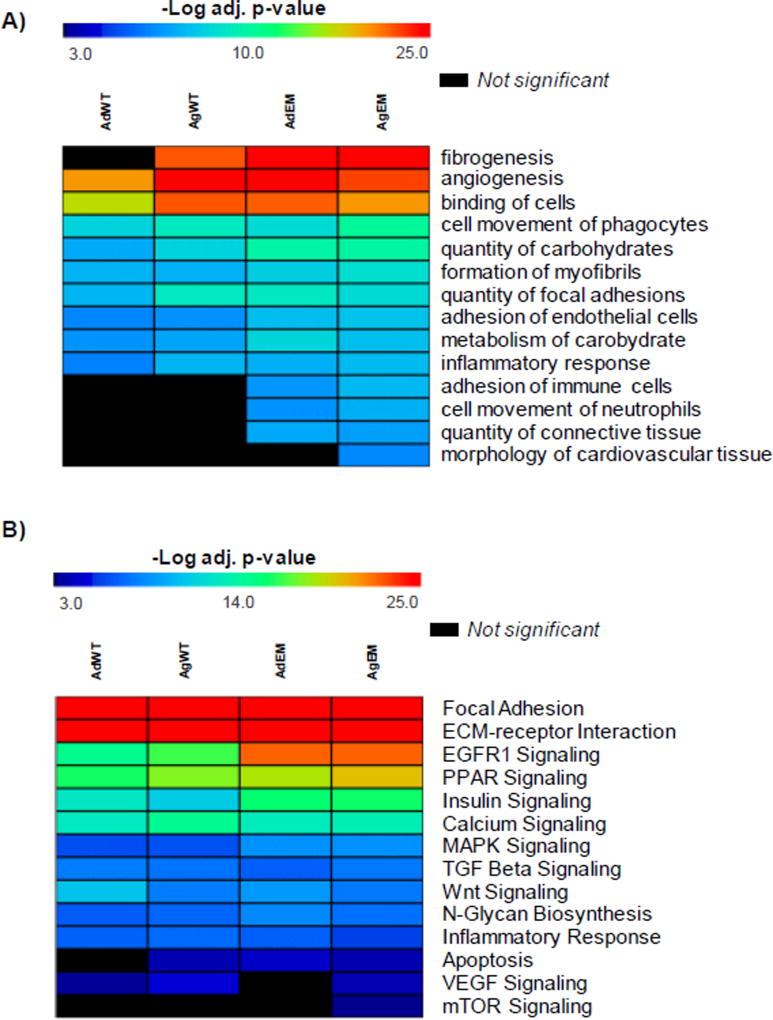
Figure 3. Heat maps for overall proteomic comparison of Emilin1−/− and WT aortic valves before and after disease manifestation.
Heat maps of functions and pathways from overall proteomic comparison of adult and aged Emilin1−/− and wild type AVs. A) Differential biological functions and processes across each of the 4 proteomes; B) Pathway enrichment from each proteome. All functions and pathways utilize negative log Fisher’s Exact p-value ≤ 1.0E-3 for statistical significance as shown on the heat map. Red is highest enrichment, blue indicates lower but significant enrichment. Black colored functions are not significant. AdWT - adult wild type; AgWT - aged wild type; AdEM - adult Emilin1−/−; AgEM - aged Emilin1−/−.

