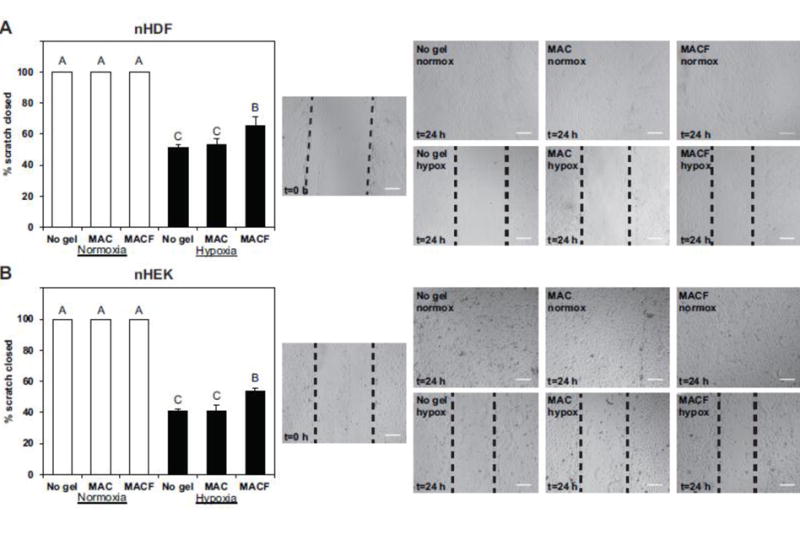
Figure 6.

Oxygenated MACF improves cell migration under hypoxia. Fibroblasts (A) and keratinocytes (B) where gown to confluency then scratched in vitro, imaged, then cultured with treatments under either normoxia (21% O2) or hypoxia (1% O2). At 24 h cultures were once again imaged. Quantification is shown on the left, white bars represent normoxia and black bars hypoxia results. All data n = 3–4, mean ± SD Letters are significantly different from one another by one-factor ANOVA (p < 0.0001). Representative images are presented on the right, with scale bars = 200 μm.
