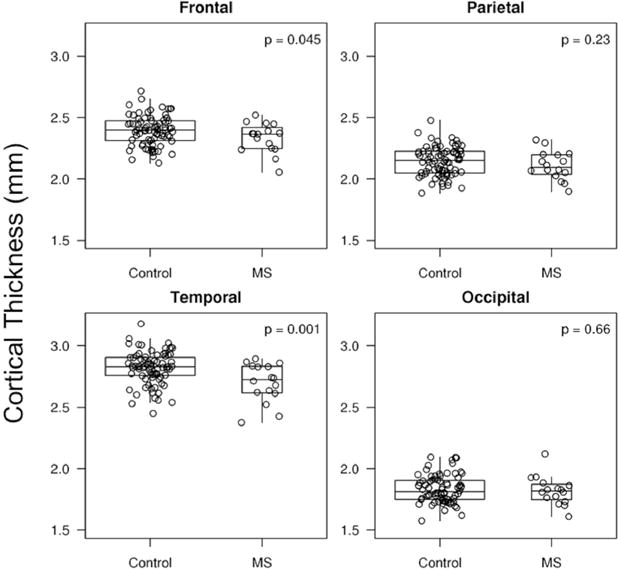
Figure-3.

Cortical thickness of patients with MS and controls (frontal, parietal, temporal and occipital lobes) are shown in boxplots ranging from 25th to 75th percentile (the middle line shows the median). The vertical lines (whiskers) above and below the box extend a distance of 1.5 × interquartile range or to the extreme value of the data in that direction, whichever comes first. Unadjusted (for white matter hyperintensity volume) p-value is shown. Patients with MS have lower cortical thickness in temporal and frontal lobes, compared to controls.
