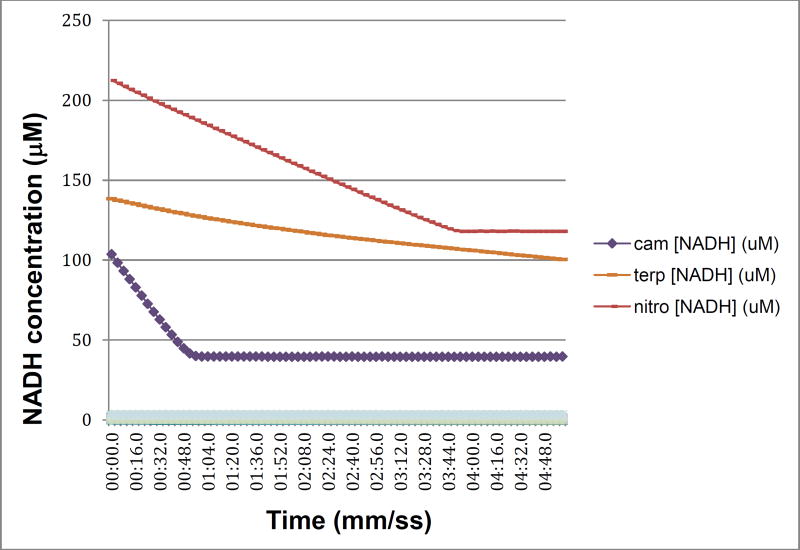
Figure 2.
NADH consumption as a function of time for WT CYP101A1/Pdx/PdR in the presence of native substrate camphor 1 (cam, purple diamonds), poor substrate α-terpineol (terp- orange dots) and m-nitroacetophenone 6 (nitro- red dots). Assay conditions are as described in Materials and Methods. X-axis is time in min:sec.0, y-axis is concentration of NADH calculated from absorbance at λ= 340 nm. The offset of the nitroacetophenone trace is due to the significant absorbance shoulder of product 7a at 340 nm.

