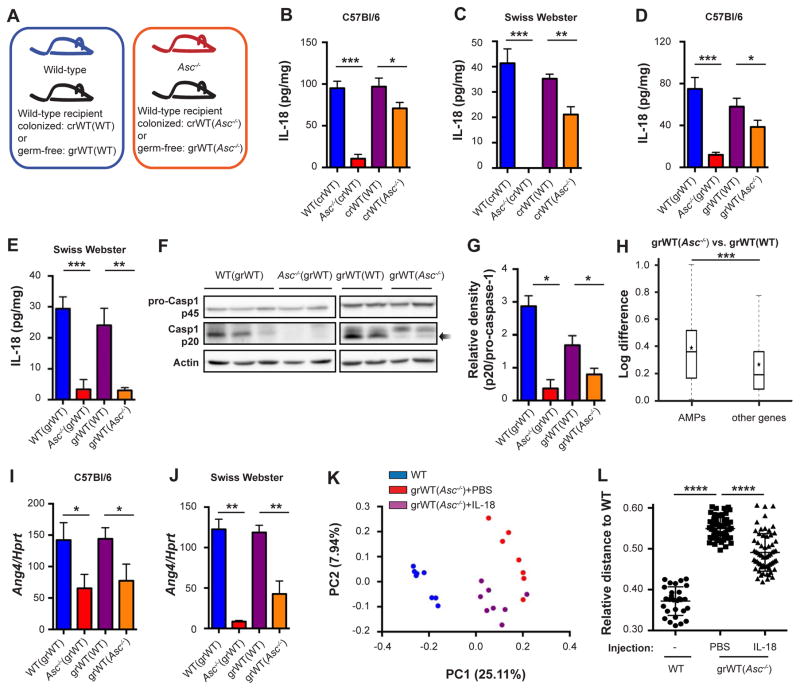
Figure 4. Dominant takeover of the dysbiotic microbiota upon cohabitation is mediated by suppression of inflammasome activity.
Colonized or germ-free WT Swiss Webster or C57Bl/6 mice were cohoused with WT mice or Asc−/− mice for 4 weeks before analysis, designated crWT(WT) and crWT(Asc−/−) when the recipients were colonized, and grWT(WT) and grWT(Asc−/−), when the recipients were germ-free.
(A) Schematic illustration demonstrating cohousing settings. WT or Asc−/− mice served as microbiota donors to either colonized WT recipients or germ-free WT recipients. In this setting, genetically identical mice harbor distinct microbiota configuration.
(B–E) IL-18 production by colon explants from WT and Asc−/− mice, as well as their respective cohousing partners (crWTs in B and C, grWTs in D and E). Recipient mice were either C57Bl/6 (B, D) or Swiss Webster (C, E).
(F, G) Immunoblot analysis (F) and quantification (G) of pro-caspase-1 (p45) and cleaved caspase-1 (p20) in colon tissue.
(H) Differential expression between grWT(WT) and grWT(Asc−/−) mice of AMPs versus all other genes. Box = interquartile range (IQR) = 25th to 75th percentile, line - median, star - mean, whiskers - IQR*1.5. Mann-Whitney U-test p<0.0001.
(I, J) Colonic transcript levels of Ang4 in WT and Asc−/− mice, as well as their respective cohousing partners (grWTs). Recipient mice were either C57Bl/6 (I) or Swiss Webster (J).
(K, L) PCoA (K) and relative distance (L) of fecal microbiota from grWT(Asc−/−) mice that were injected with either PBS or IL-18, followed by a fecal microbiota analysis. WT mice serve as controls.
Data are expressed as mean ± SEM. * p<0.05; ** p<0.01; *** p<0.001.
Pairwise comparison was performed using Student’s t test, unless stated otherwise.
Results shown are representative of 2–4 independent repeats (n=3–6 per group).
See also Figure S3.

