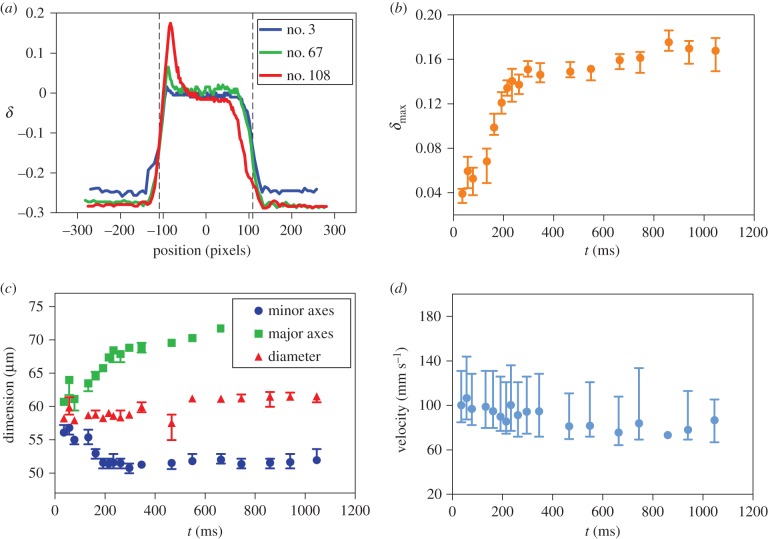
Figure 3.
(a) The relative deformations of the droplets flowing in the chambers are quantitatively described using the relationship δ = (L − l)/(L + l). Maximum deflections were defined as the peak values in each of the chambers. The dashed lines show the boundaries of the chamber. The variation in (b) the maximum deformation, (c) droplet dimension and (d) velocity in time when the droplet flows through the delay line and the deformation reaches maximum (data shown on the example of droplets in 0.5 mM surfactin solution). Green and blue symbols in (c) represent the maximum value of the major and minor axes of the droplet, respectively, and the red symbols are the averaged droplet diameters when the relative deformation was δ < 0.01. The error bars correspond to the highest and lowest values.

