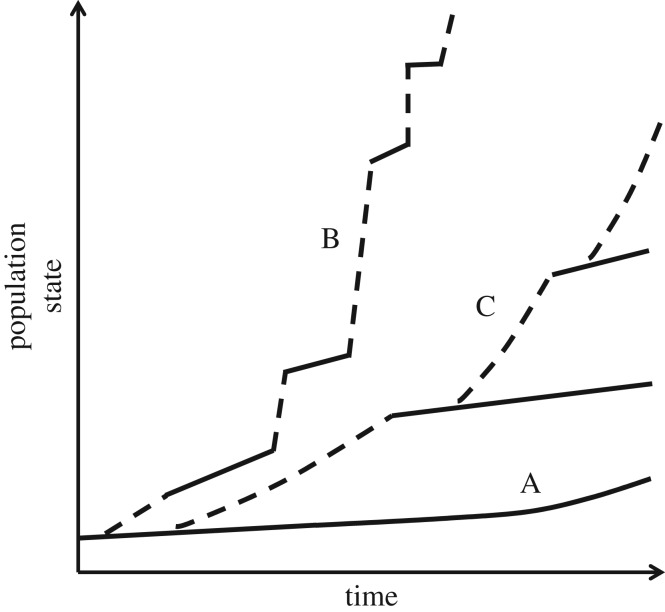
Figure 3.
Illustration of how innovations may impact the state of a population through time. In (A), the population adapts, but does not innovate. It is also possible that no adaptation occurs during certain periods (zero slope) or that the population maladapts (negative slope; not shown). In (B), the population innovates without appreciably altering its ecological niche. Innovations (dotted segments) are infrequent step departures from the prevailing adaptive trend (solid segments). Innovations become increasingly frequent as the population grows in size (due to, for example, more mutations or more recombination events) and as the population accumulates or acquires more information (e.g. trait complexity and variants; cumulative culture). In (C), the population innovates (dotted segments) and in so doing invades and subsequently radiates in a new ecological niche. Four such populations (or species) are illustrated here (ancestor line A, the initial innovating lineage, and two subsequent derived populations/species, each innovation represented by a dashed black line followed by a solid line, the latter representing periods of adaptation). Note that ‘population state’ could be represented as any of a number of possible correlates of evolutionary adaptation, including population size, absolute fitness, relative fitness (selection), phenotypic complexity or cumulative culture. The trajectories in this figure therefore represent a hypothetical index that increases with adaptive (continuous) or innovative (step) change.

