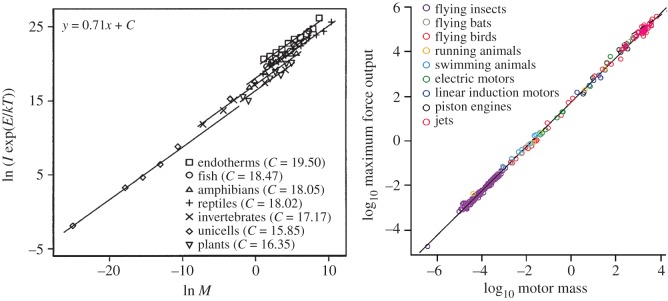
Figure 6.
Scaling in biology and technology. Left panel shows relationship between temperature-corrected metabolic rate, ln (I exp(E/kT)), measured in watts, and body mass, ln M, measured in grams. Variables are M, body size; I, individual metabolic rate; k, Boltzmann's constant; T, absolute temperature (in K). E is the activation energy (after [91]). Right panel shows the scaling of force output for different biological and engineered motors (after [92]).

