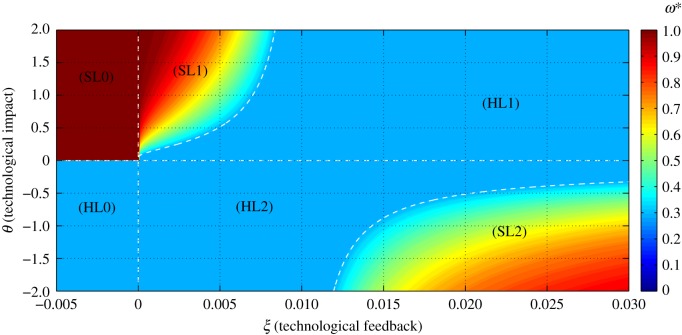
Figure 3.
Phase-space diagram to classify the different types of dynamics exhibited by our model of human population growth coupled with innovation acting upon the provision of ecosystem services at equilibrium or habitat quality (ω*) of our planet. In this phase space, we represent the dynamics as driven by two key parameters, θ, which represents the net effect of technology upon ecosystem services (with θ < 0 implying that the costs of increasing the provision of ecosystem services, through technological innovation, are larger than the benefits accrued to humans), and the parameter  , which represents the relationship between the lifetime of a technology 1/l and its impact upon fostering new technological advances mediated by the per capita innovation rate (ρ). A positive ξ means that ρ < l, implying that technologies tend to have little impact upon further technological innovation and long lifetimes. Regions identified with SL correspond to the Spatial Limitation equilibrium, whereas regions identified with HL refer to the Habitat Limitation one. Biomass saturation occurs in regions SL0, SL1 and SL2, and biomass collapse is likely in HL0 and HL1.

