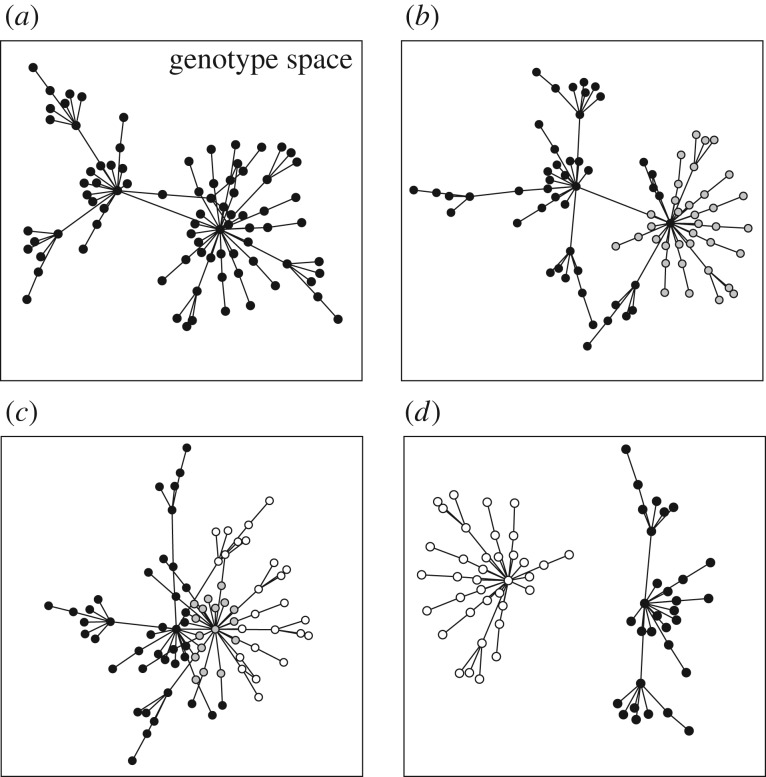
Figure 1.
Sets of genotypes with the same phenotype can have various topological relationships. Large rectangles symbolize genotype space, circles correspond to genotypes and straight lines connect 1-mutant neighbours, i.e. genotypes that differ by a small genetic change such as a single nucleotide change. Each set of genotypes is shown as a network, because such sets form networks in genotype space. (a) A hypothetical set (network) of genotypes with the same phenotype. The set is shown as a single genotype network, but I note that it could consist of multiple disconnected networks. (b) Two sets of genotypes: the first associated with an old phenotype (black and grey circles) and the second with a new phenotype (grey circles only, a subset of the first set). (c) Sets of genotypes with an old phenotype (black circles), a new phenotype (white circles) or with both an old and a new phenotype (grey circles). Unlike in (b), the genotype set of the new phenotype is not a subset of the genotype set with the old phenotype. (d) The sets of genotypes encoding different phenotypes can be non-overlapping.

