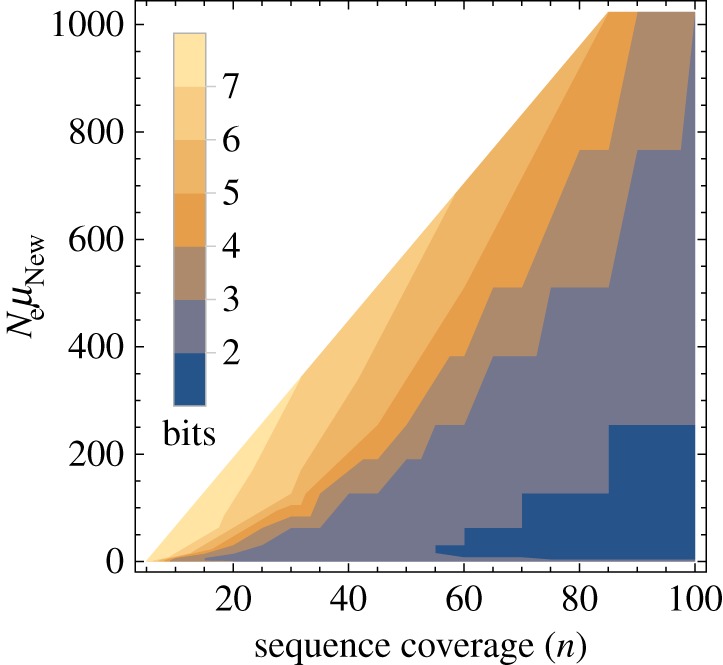
Figure 3.

High-throughput sequencing can help distinguish even modest differences in phenotypic information content. Minimally distinguishable information content of two phenotypes (in bits), colour-coded as indicated in the legend, for a given sequence coverage n (horizontal axis), and a given value of  . To create this plot, I chose multiple values of n and θNew and determined the minimal value of θOld,
  , such that
  (see electronic supplementary material, Methods S1) for each of these values. The minimally detectable information difference is then given by
