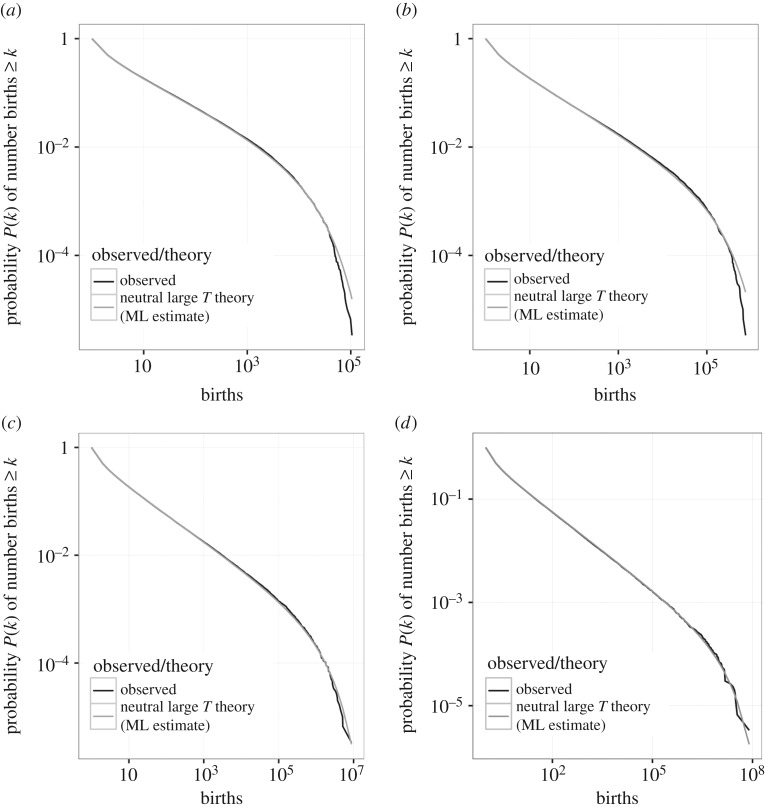
Figure 3.
Cumulative progeny distributions for long time intervals determined by simulated, neutral populations based on competitive Lotka–Volterra interactions with overlapping generations (black lines) match their mean field, non-zero sum approximations (3.2) (grey lines). We consider parameter values: (a) J = 300, ν = 0.01, (b) J = 1000, ν = 0.003, (c) J = 3000, ν = 0.01, (d) J = 10 000, ν = 0.0003. In all cases, the product Jν has been chosen to be ≃3, so that the mean field regime is reached, and in each case the simulated progeny distribution was logged for T = 100 000 generations. ML, maximum likelihood.

