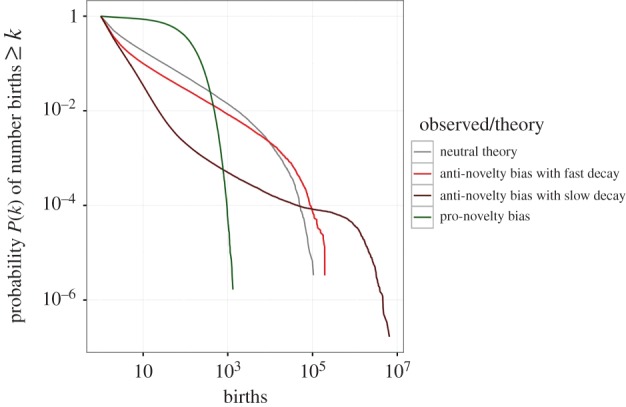
Figure 4.

Cumulative progeny distributions generated by neutral theory (grey line), pro-novelty bias (green line) and anti-novelty bias (light red and dark red lines) for J = 300 and ν = 0.01. For pro- and anti-novelty bias the asymmetry parameter is set to ɛ0 = −1. For anti-novelty bias, the decrease of the competitive difference is chosen to be λ = 0.3 (dark red) and λ = 3 (light red line). In each case, the simulated progeny distribution was logged for T = 100 000 generations.
