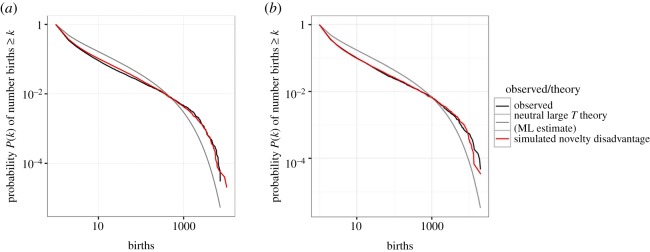
Figure 5.
Cumulative progeny distributions for South Australian girls' names (a) and boys' names (b). Black lines: empirical distributions over a 70-year span, grey lines: neutral progeny distribution with maximum-likelihood parameters, red lines: progeny distribution for novelty disadvantage. ML, maximum likelihood.

