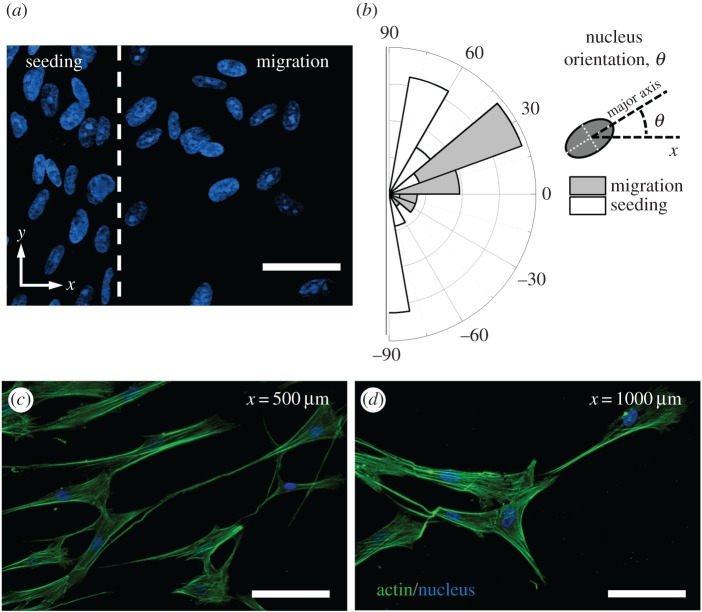
Figure 5.
Morphological characteristics of migrating fibroblasts. (a) Comparison of orientations of nuclei in cells that have started migrating (right) and quiescent cells within the seeding region (left). Scale bar is 50 µm. (b) Distribution of nucleus orientation for cells within the migration and seeding regions as illustrated in (a). Nuclear morphology (blue) and actin cytoskeletal organization (green) of fibroblasts that have migrated over distances of (c) 500 μm and (d) 1000 μm from the baseline after 24 h. Scale bars are 100 µm. The images are from cells migrating on 3.0 mg ml−1 collagen matrices. (Online version in colour.)

