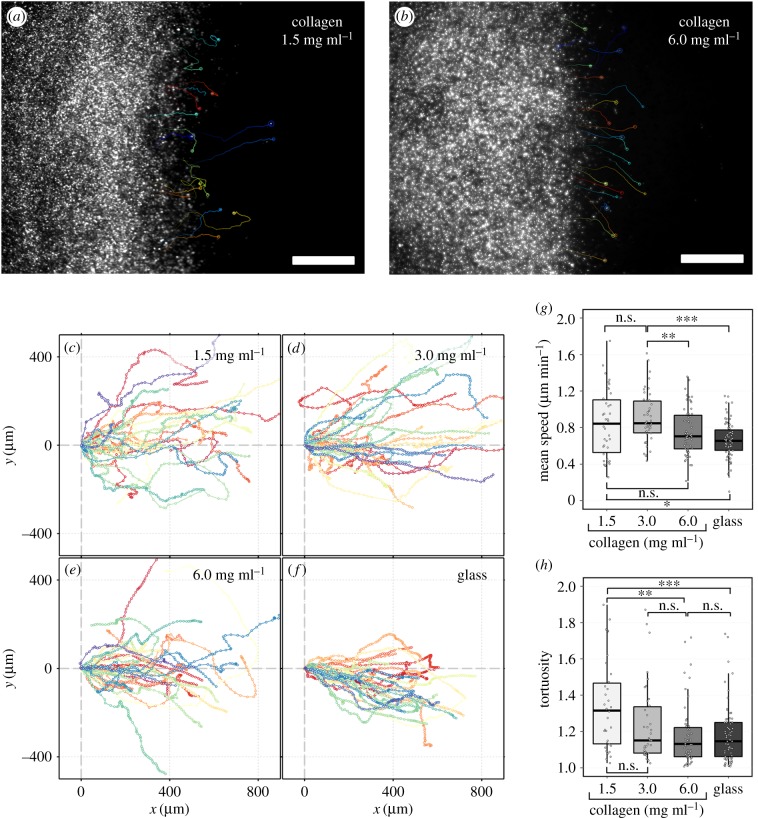
Figure 6.
Dynamic characteristics of fibroblast migration on collagen matrices and glass substrate. Apparent trajectories of cells migrating on (a) low density (1.5 mg ml−1) and (b) high density (6.0 mg ml−1) collagen matrices. Trajectories of single cells are indicated by individually coloured solid lines superimposed upon snapshots of QD intensity at 24 h. Scale bars are 500 μm. (c–f) Trajectories of 30 randomly selected cells migrating on different substrates where each trajectory indicates the relative movement of the cell with respect to the matrix, superimposed on a common origin for illustration purposes. (g) Mean speed and (h) tortuosity of cell trajectories for cells migrating on different substrates. **p-value < 0.01, ***p-value < 0.001. (Online version in colour.)

