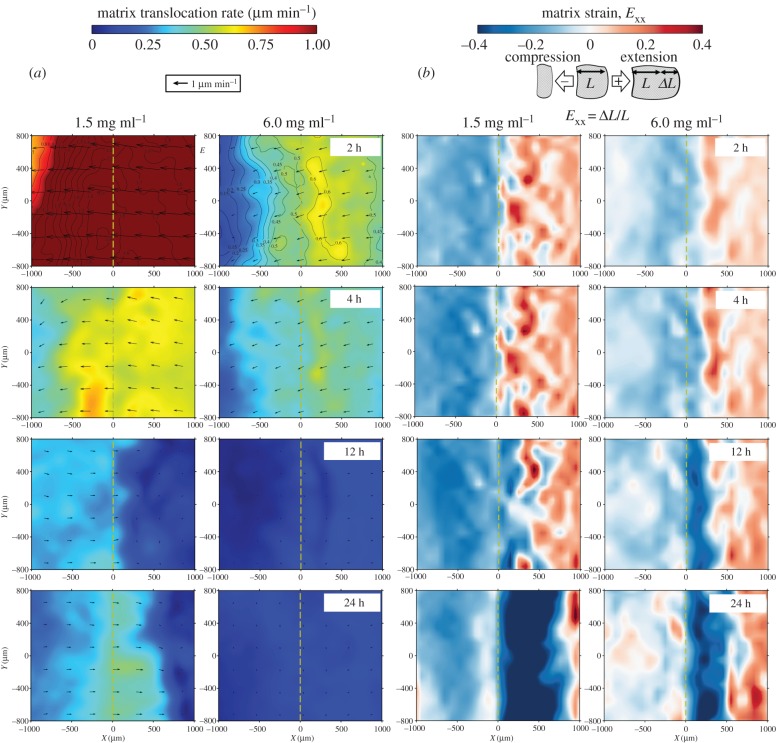
Figure 9.
Fibroblast-induced spatio-temporal matrix translocation and deformation at the hydrogel surface (z = 0 µm). (a) Matrix translocation and (b) deformation maps at different time points. In each case, low and high density collagen matrices are compared. The magnitude of the translocation rate is indicated by colour-coded contours while the direction of instantaneous translocation is indicated by superimposed arrows. (Online version in colour.)

