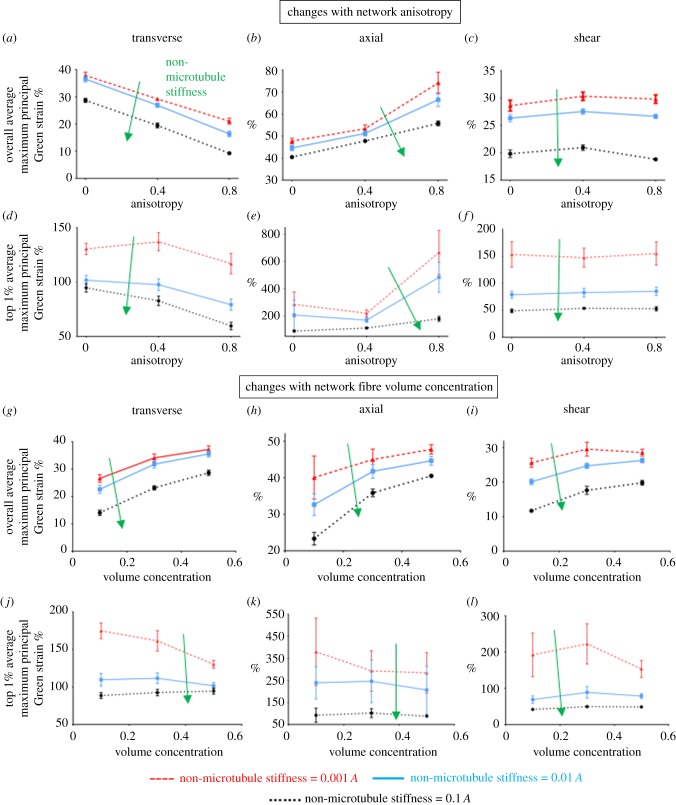
Figure 5.
Correlation of fibres' anisotropy (a–f) and volume concentration (g–l) with axonal strains during transverse (a, d, g and j), axial (b, e, h and k), and shear loading (c, f, I and l) of the fibre networks. Results are for different stiffness (0.1 A, 0.01 A and 0.001 A where A is the stiffness of the collagen fibres) of the non-microtubule part of the axon model. Lines show the mean values (n = 8), and error bars are the 95% CI. At some data points, error bars are small and they are covered under the symbol.

