
Figure 6.
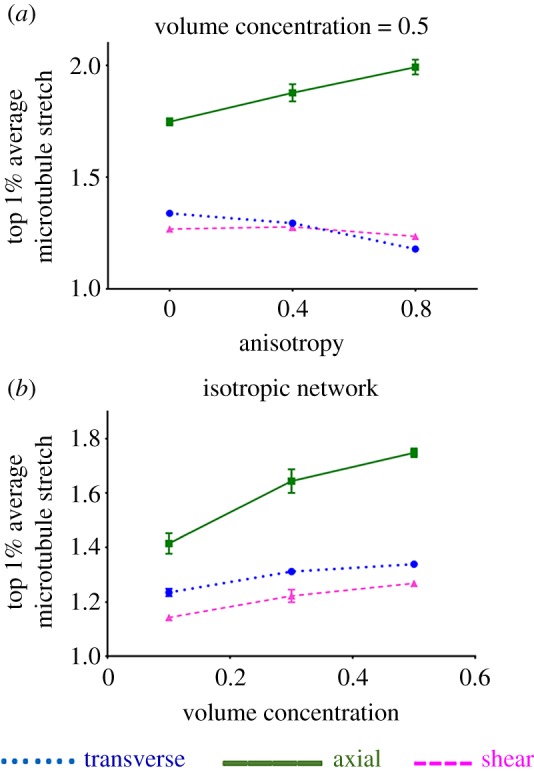
The correlation of microtubules stretch with fibres’ (a) anisotropy and (b) volume concentration, for transverse, axial and shear loading. MTSR_TOP is the average of microtubule stretch in the top 1% high-stretched microtubule segments. Lines show the mean values (n = 8), and error bars are 95% CI. At some data points, error bars are small and they are covered under the symbol.