Figure 4.

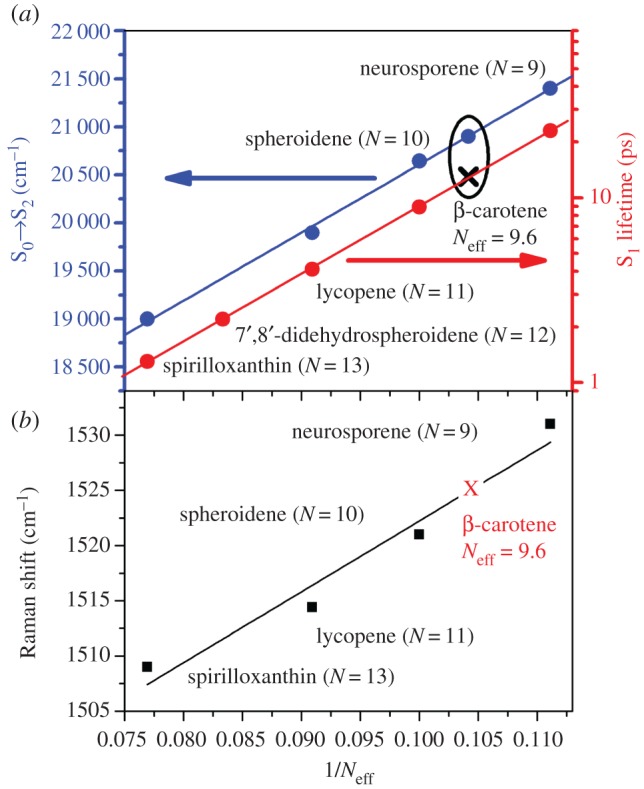
(a) Correlation between the position of the S0 → S2 electronic transition (blue data) [76,77] and the S1 decay rate (red data—y axis is in log scale) [73] with the inverse of the number of conjugated double bonds, N, for linear carotenoids in n-hexane. (b) Correlation between the position of the ν1 Raman band and the inverse of the effective conjugated double bonds, Neff, for linear carotenoids in n-hexane.
