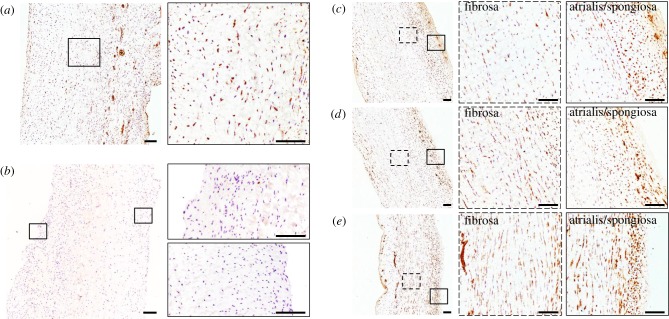
Figure 5.
Representative micrographs of α-SMA expression in post-mortem MV samples (a) and after a 48-h cyclic stretch treatment at 10% (c), 20% (d) and 30% (e). The higher levels of α-SMA expression in VICs within the fibrosa layer suggest cellular activation and phenotypic transition from a fibroblast-like phenotype to a myofibroblast-like phenotype at higher strain levels. (b) Representative micrographs of CD31 expression of post-mortem control sample demonstrate successful removal of endothelial cells from the outer layers of the valve samples prior to the bioreactor treatment. Scale bar, 250 µm. (Online version in colour.)

