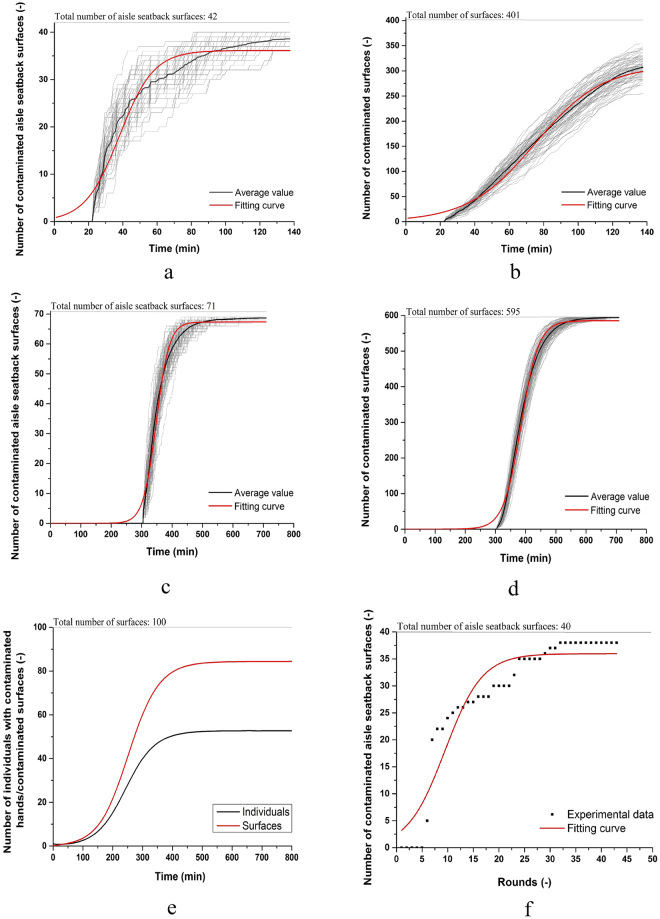
Figure 3.
Growth of the number of contaminated surfaces (a). GII 737 outbreak, aisle seatback surfaces, (b) GII 737 outbreak, all surfaces; (c) GI 747 outbreak, aisle seatback surfaces, (d) GI 747 outbreak, all surfaces; (e) predicted result for both surfaces and individuals using a theoretical model shown in Supplementary Section 1.2; and (f) measured results (Supplementary Section 1.3). In (a–d), each graph shows 100 simulations (grey) together with the average of these 100 simulations (black), and the fitting curve using the logistic function (red).

