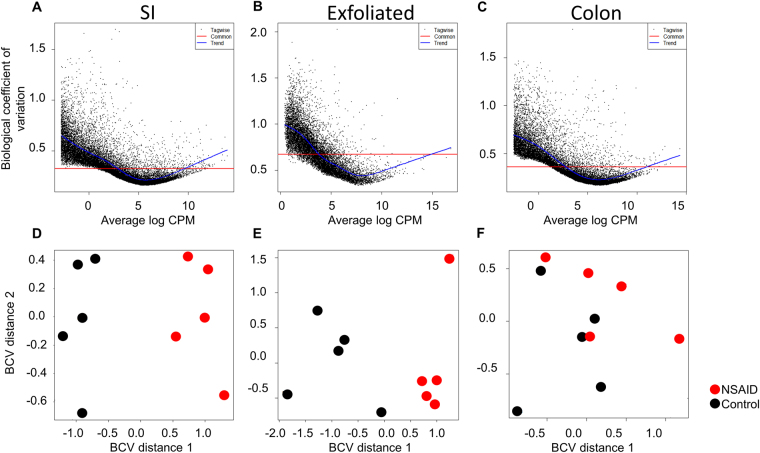
Figure 3.
SI transcriptome and exfoliome cluster by treatment group in contrast to colonic transcriptome and biological variability is higher in the exfoliome than the tissue transcriptomes. Biological coefficient of variation (BCV) versus the mean log counts per million (CPM) of the SI transcriptome (A), exfoliome (B) and colonic transcriptome (C). (D) Treatment-based multi-dimensional scaling (MDS) plots of the SI transcriptome and that of the exfoliome (E) and colon (F).

