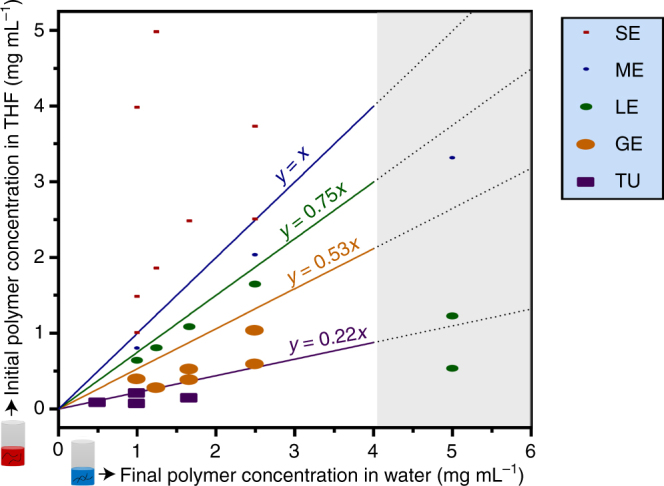
Fig. 3.

Phase diagram for the self-assembly of PEG43-b-P(NIPAM21-co-PDMI9) using different THF:water solvent systems. GE, giant ellipsoidal polymersomes; ME, medium ellipsoidal polymersomes; SE, small ellipsoidal micelles; TU, tubular polymersomes. Phase boundaries are represented by straight lines of equation y = mx + c (where m = 1, 0.75, 0.53, or 0.22) as depicted in the diagram. The phase boundary lines can be interpreted as follows: in order to obtain ME, one can use any solvent combination that lies within the region between y = 0.75x (green straight line) and y = x (blue straight line); e.g., if a final polymer concentration in water of 1 mg mL−1 is used, the initial polymer concentration in THF should be between 0.75–1 mg mL−1. The gray highlighted region on the right side of the phase diagram indicates a region in which the phase boundary lines become no longer valid due to the tendency of the polymer to precipitate out of solution at low water content
