Figure 3.
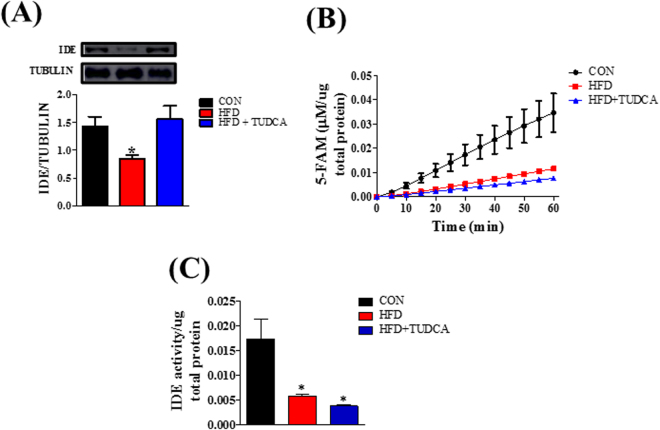
TUDCA treatment increases IDE expression, but not activity in HFD mice. Protein expression of IDE in the liver and its representative immunoblotting images (A). Kinetic of IDE activity assay (B) and total IDE activity (C) in the liver of mice. Fluorescent intensity at Ex/Em = 490/520 nm was recorded, every 5 min, during 60 min. 5-FAM concentration was calculated using a standard curve and normalized per μg of total protein. Mice were fed a control diet (CON) or high fat diet (HFD and HFD + TUDCA) for 12 weeks, and received or not i.p. 300 mg/kg TUDCA during 15 days, as indicated. Data are mean ± SEM (n = 4–8). Data are mean ± SEM (n = 4–8). *P ≤ 0.05 vs CON.

