Fig. 1.
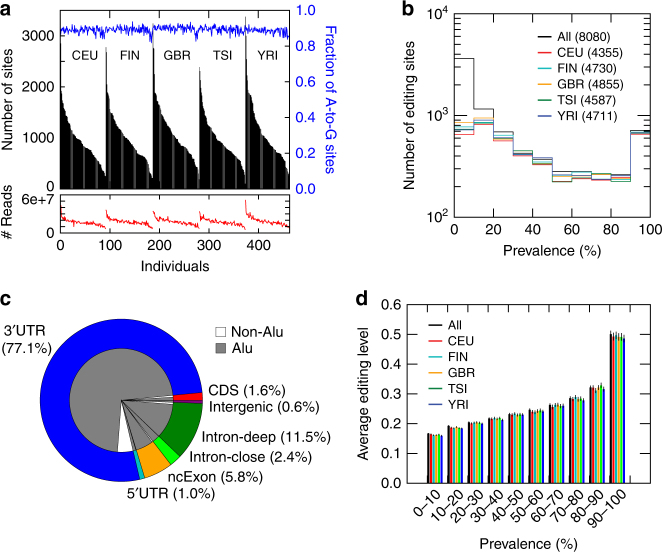
Profile of A-to-I editing in human populations. a The total number of RNA-DNA mismatched sites (black bars) identified in RNA-Seq data of each individual in each population, along with the fraction of A-to-G editing sites among all sites (blue), and the number of uniquely mapped reads per sample (red). Individuals are grouped by population first and then sorted by the total number of sites. a Prevalence of predicted A-to-I editing sites in each population. Prevalence of an editing site in a population is defined as % of individuals with the site edited among all individuals with read coverage ≥ 10 (i.e., testable sites). The total number of unique A-to-I editing sites in each population or in the union of all individuals is included in brackets. c Genomic distribution of predicted A-to-I editing sites. Intron-close: intronic editing sites within 300 nts from exon-intron boundaries; CDS: coding sequence; UTR: untranslated region; Intron-deep: intronic editing sites more than 300 nts away from exon-intron boundaries; ncExon: exons in non-coding transcripts. d Average editing level per population for editing sites in different prevalence groups (number of editing sites in each group is shown in b). Error bars represent confidence intervals

