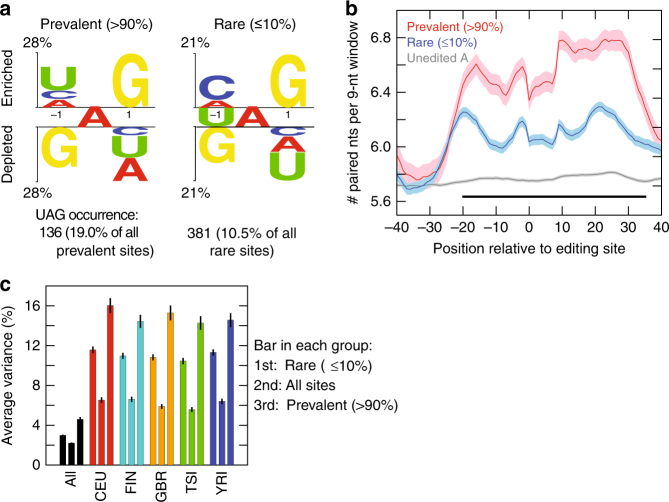
Fig. 2.
Comparison of prevalent and rare editing sites. a Sequence preference for positions flanking prevalent and rare A-to-I editing sites, represented using a two-sample logo program69. A total of 714 prevalent (prevalence > 90%) and 3618 rare (prevalence ≤ 10%) editing sites were included, respectively. The number of occurrences of the ‘UAG’ motif is shown below each graph. The ‘UAG’ sequence is significantly enriched around prevalent sites compared to rare sites (p = 1.4e-9, Fisher’s Exact test). Prevalent and rare editing sites were defined using editing sites of the union of all individuals (same below). b Average number of paired nucleotides in a sliding window of 9 nucleotides (corresponding to the length of ADAR binding region70) near prevalent (red) and rare (blue) editing sites, and near random adenosines (gray) located 200–300 nucleotides from editing sites. Shaded areas represent the standard error of the mean. Horizontal black bar indicates the region where there are significant differences between the numbers of paired nucleotides around prevalent and rare editing sites (p < 0.01, Wilcoxon Rank-Sum test). c Variance in editing levels across individuals explained by ADAR expression levels (ADAR1, ADAR2, and ADAR3) in a linear model. Average values of rare (3618 sites), all (8080) and prevalent sites (714) are shown (ordered as the 1st, 2nd, and 3rd bar in each group, respectively). Error bars represent confidence intervals

