Fig. 3.
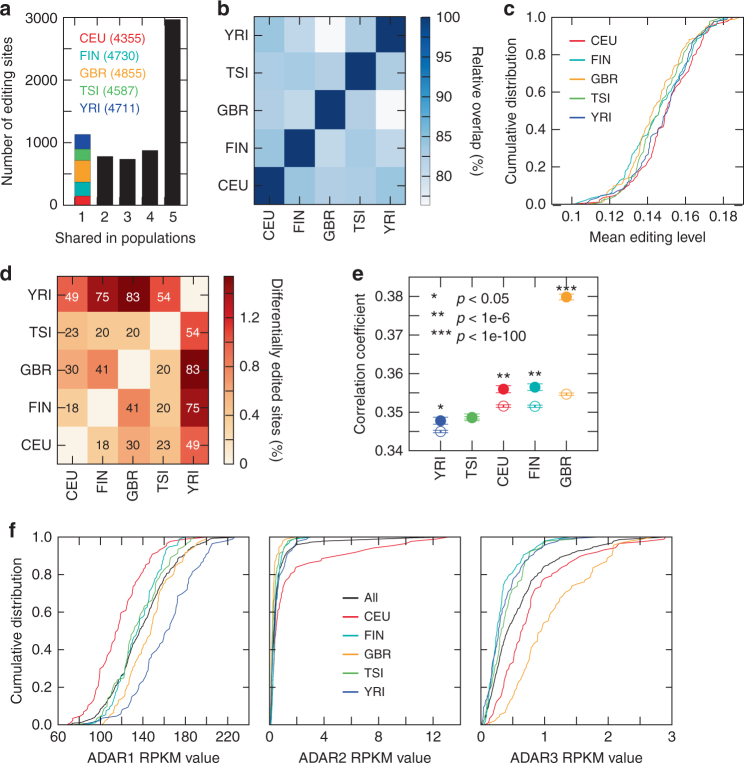
Comparison of editomes across populations. a Number of A-to-I editing sites shared between populations. Editing sites specific to one population are color-coded. The total number of editing sites included for each population is shown in parenthesis. b Overlap of editing sites between a pair of populations. Percentages calculated relative to the number of editing sites in the population with the smaller total number of sites. The overlap was significant (p < 1e-20, Hypergeometric test) for all comparisons. c Cumulative distributions of average editing levels (per individual) in different populations. d Percentage of differentially edited sites between a pair of populations (p < 0.01, Wilcoxon Rank-Sum test, see Methods), relative to the total number of testable sites in each pairwise comparison. The number of differentially edited sites is indicated in each grid. e Correlation coefficients of editing levels in two individuals from the same population (filled circles) and of two individuals from different populations (with one individual from the indicated population, the other from any other population, empty circles). Mean and standard error are shown. P values are shown to compare the difference between intra- and inter-population correlations (Wilcoxon Rank-Sum test). f ADAR expression levels in different populations

