Fig. 4.
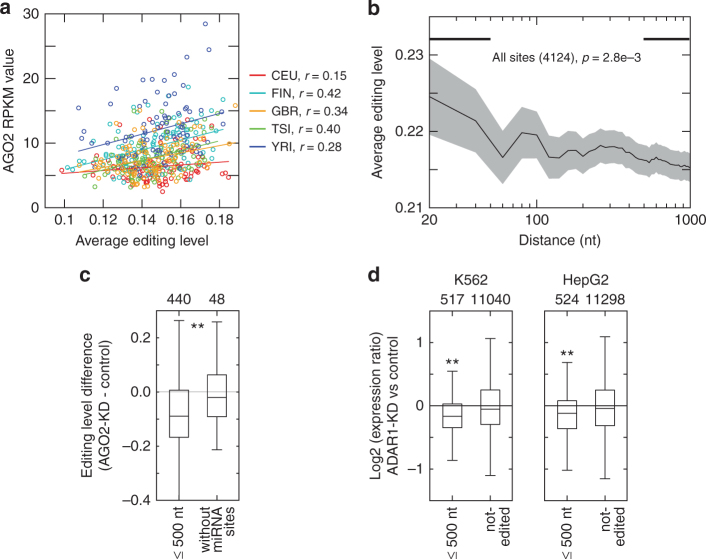
Correlation between AGO2-miRNAs targeting and RNA editing levels. a Correlation of average editing levels (per individual) with AGO2 RPKM levels. Pearson correlation coefficients are shown. b Average editing level in dependence of the distance between an editing site and a predicted miRNA target site. The average was taken over all editing sites with distances ≤ the distance shown on the x-axis. Shaded areas represent standard error of the mean. P value is shown to compare editing level difference at editing sites close (<50 nt, black bar at top) and relatively far (500–1000 nt, black bar at top) from predicted miRNA target sites (Wilcoxon Rank-Sum test). c Editing level differences (AGO2 KD minus control, K562 cells) of two groups of editing sites identified in the Geuvadis RNA-Seq data. Left: editing sites located in 3′ UTRs within 500 nt from predicted miRNA target sites; right: editing sites in 3′ UTRs without predicted miRNA target sites. The number of genes in each group is shown on top. P value was calculated to compare the editing level differences between the two groups of editing sites (Wilcoxon Rank-Sum test). **: p < 1e-3. d Gene expression changes upon ADAR1 KD compared to control (K562 and HepG2 cells, respectively) in two groups of genes (with number of genes indicated on top). Group 1 consists of genes with editing sites (identified in the Geuvadis RNA-Seq data) within 500 nt from predicted miRNA target sites (left box in each panel); group 2 consists of genes without editing sites in 3′ UTRs (right box in each panel). Expression ratio was calculated as RPKM ratio of KD to control. P values were calculated to compare the log2 fold changes in RPKM values of the two groups of genes (Wilcoxon Rank-Sum test). **: p < 1e-7

