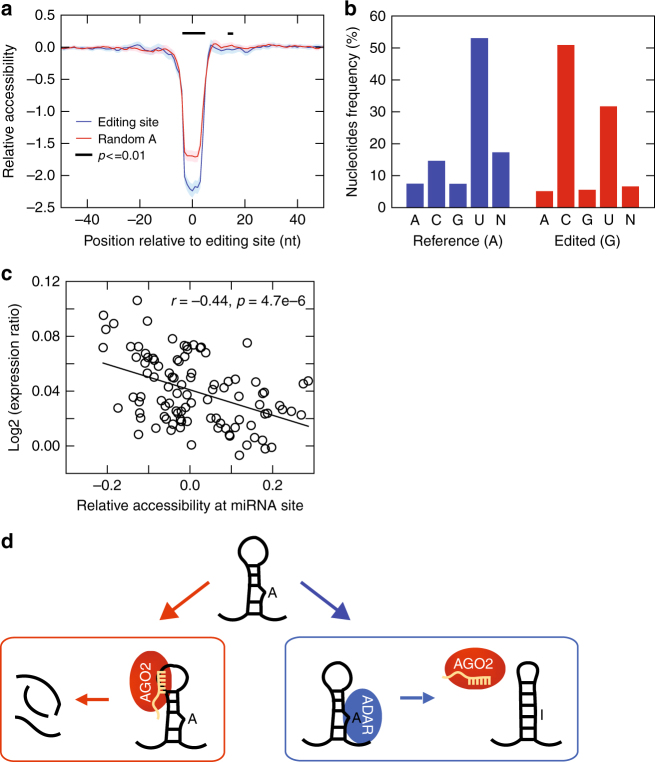
Fig. 6.
Editing-dependent RNA structural changes near AGO2-miRNA target sites. a Profile of relative 7mer accessibility around editing sites located in 3′UTRs and within 100 nt from predicted miRNA target sites (blue), and around random A positions (red). Y-axis shows log2 fold change in the probability of accessibility of a 7mer (centered at the position indicated on the x-axis) between structures folded using the edited (G) vs. unedited (A) version of the sequences calculated using RNAplfold46 (see Methods). Shaded areas represent confidence intervals. Black bar indicates regions with a significant difference comparing the relative accessibilities around editing sites and random A’s (p value < 0.01, Wilcoxon Rank-Sum test). b Nucleotide frequencies opposite to the editing site in minimum free energy structures predicted with RNAfold68 using the unedited (blue bars) and edited sequences (red bars). ‘N’ is shown for structures where the editing site was unpaired and the opposite nucleotide was ambiguous (e.g., if the editing site was in a hairpin loop or bulge with multiple likely opposite nucleotides). c Correlation between relative 7mer accessibilities (calculated as in a) at predicted miRNA target sites (x-axis) and gene expression differences between edited (editing level ≥ 0.3) and non-edited individuals (y-axis, ratio calculated as edited/non-edited). Each circle represents average values of relative accessibility and expression ratio of a group of miRNA target sites (x-axis) and genes (y-axis) with similar distance (differing by ≤ 10 nt) between editing sites and miRNA target sites. Pearson correlation coefficient and significance of correlation are shown. d Scheme for the proposed structure-mediated regulation of target mRNA abundance depending on A-to-I editing

