Fig. 7.
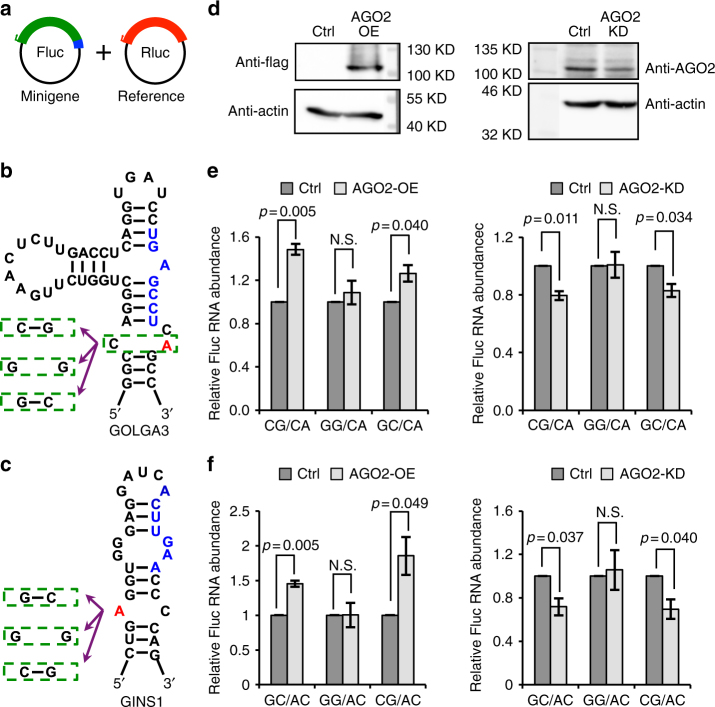
RNA editing-induced secondary structural changes affect RNA abundance. a Schematic diagram of the minigene system. Target sequences (3′ UTRs of GOLGA3 and GINS1) and their mutant versions were inserted into the firefly luciferase (Fluc) 3′ UTR. Renilla luciferase (Rluc) was used as a reference reporter. Fluc and Rluc were co-transfected into HEK 293 control cells, AGO2 overexpression (OE) and AGO2 knockdown (KD) cells. RT-qPCR was carried out 48 h after transfection (details described in Methods). Green region represents firefly luciferase, red region represents Renilla luciferase and blue represents inserted target sequences or mutant versions. b Predicted RNA secondary structure of GOLGA3 3′ UTR flanking the RNA editing site. The “A” nucleotide at the editing site is highlighted in red. Blue sequences correspond to predicted miRNA target site (of the miRNA seed region). Green dashed boxes illustrate the unedited (A), pre-edited (G) and mutant nucleotides and their counterpart bases in the predicted RNA secondary structure, respectively. c Similar as b, but for the GINS1 gene. d Western blot of AGO2 expression in control cells and cells with AGO2 OE or KD. e, f Relative RNA expression levels of minigenes with unedited, pre-edited or mutant versions of the sequences shown in b and c respectively. Fluc and Rluc vectors were co-transfected into HEK293 control (Ctrl) cells and cells with AGO2-OE (left panel) or AGO2-KD (right panel). Relative Fluc RNA abundance between pre-edited (or mutant) and unedited versions of the minigenes is shown (see x-axis labels). Error bars represent standard deviation based on three experimental replicates. P values were calculated using Wilcoxon Rank-Sum test. N.S. not significant (p ≥ 0.05)

