Fig. 3.
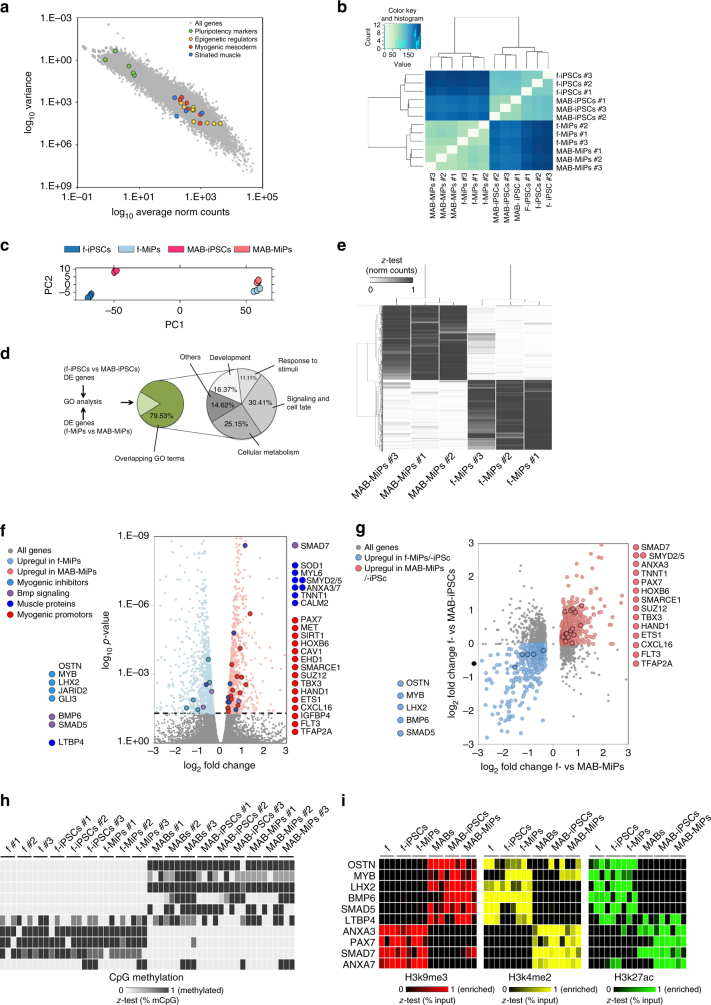
RNA-seq shows progeny-specific retention of part of transcriptional profile. a Log10 plot of variance vs normalized (norm) count for all genes detected in fibroblast- and MAB-MiPs. Data points depict average values of detected genes. Genes associated with pluripotency and with epigenetic/genetic control on muscle mesoderm are highlighted. b Unbiased clustering of all MiP and parental iPSC samples analyzed by RNA-seq. c PC analysis of all samples reveals stage-specific, progeny-specific clustering. d GO analysis (Biological Process) of DE genes between fibroblast- and MAB-derived cells reveals that >79% GO terms are overlapping between MiP and iPSC stages. Sub-categorization of overlapping GO terms is charted at the right. e Heatmap (z-test) of DE genes (threshold, >10 norm counts) discriminating fibroblast- and MAB-MiPs. f Volcano plot of fold change vs p-value of all DE genes at MiP stage (threshold, P = 0.05, dashed line). Left side of the chart, all genes and highlighted candidates enriched in fibroblast-MiPs; right side, genes and candidates enriched in MAB-MiPs. g Log2 chart of fold change at MiP stage vs at iPSC stage of significantly DE genes (threshold, P < 0.05 at MiP stage). Light blue dots depict genes upregulated in fibroblast-iPSCs and fibroblast-MiPs, while light red dots depict upregulated genes in MAB-iPSCs and MAB-MiPs. Circled dots represent the candidates, as identified in f, with conserved DE trend. h Quantitation of results obtained from bisulfite sequencing of upstream CpG islands of selected gene shortlists in fibroblast- and MAB-MiPs, and their parental iPSC and somatic cells. Data is depicted as heatmap (z-test) of average percentages of methylated CpGs (n = 3 replicates/cell clone). i Quantitation of results obtained from ChIP-qPCR experiments analyzing fibroblast- and MAB-MiPs, and their parental iPSC and somatic cells. H3k9me3, repressive mark; H3k4me2, H3k27ac, permissive marks. Data is depicted as heatmap (z-test) of average percentages of IP-enriched vs total input DNA (n = 3 replicates/cell clone). f-, fibroblast-derived, DE, differentially expressed

