Fig. 5.
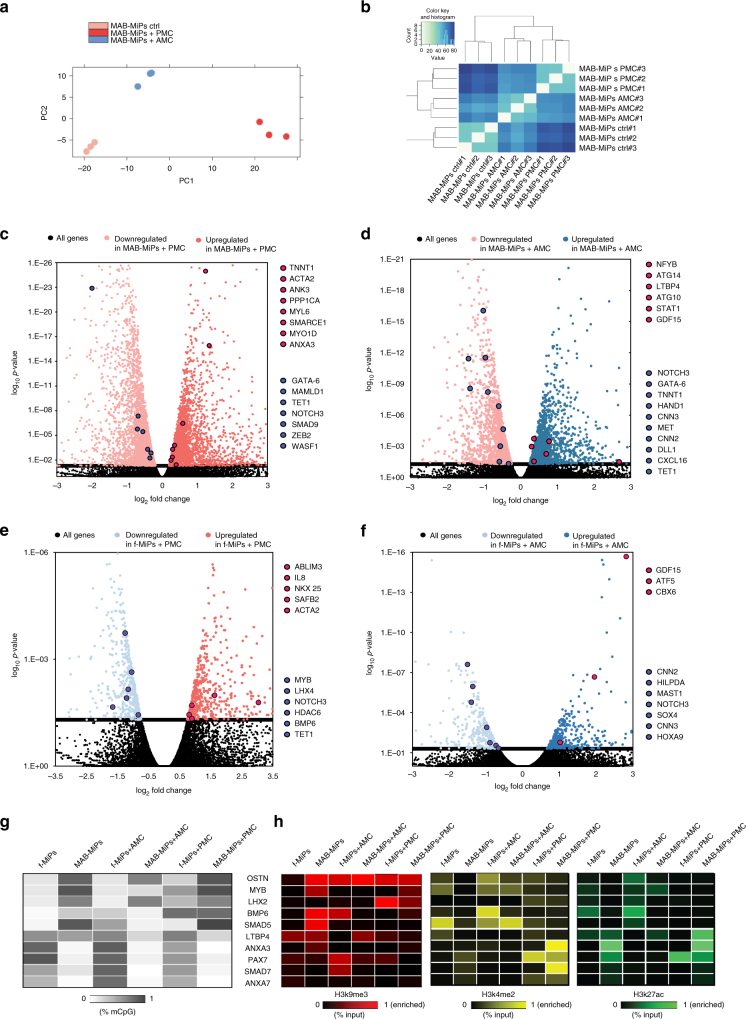
RNA-seq after miRNA cocktail exposures shows myogenic-specific comittment enhancement of transcriptional profile. a PC analysis of a MAB-MiPs samples reveals stage-specific, progeny-specific clustering. b Unbiased clustering of MAB-MiPs analyzed by RNA-seq. c–f Volcano plots of fold change vs p-value of all DE genes in different conditions (threshold, P = 0.05, dashed line). MAB-MiPs untreated vs MAB-MiPs+AMC c, MAB-MiPs untreated vs MAB-MiPs+PMC d, fibroblast-MiPs untreated vs fibroblasts-MiPs+AMC e, fibroblast-MiPs untreated vs fibroblasts-MiPs+PMC f. Left side of all charts, all genes and highlighted candidates enriched in untreated-MiPs; right side, genes and candidates enriched in treated-MiPs. Blue dots depict genes that were found downregulated while red dots depict genes that were found upregulated upon treatments. g Quantitation of results obtained from bisulfite sequencing of upstream CpG islands of selected anti-myogenic and pro-myogenic gene pools in treated and untreated cells. Data is depicted as heatmap of average percentages of methylated CpGs. h Quantitation of results obtained from ChIP-qPCR experiments analyzing fibroblast- and MAB-MiPs treated and untreated. H3k9me3, repressive marker; H3k4me2, H3k27ac, permissive markers. Data is depicted as heatmap of average percentages of IP-enriched vs total input DNA (n = 3). f-, fibroblast-derived. AMC, anti-myogenic cocktail (miRNA-based), PMC, pro-myogenic cocktail (miRNA-based)

