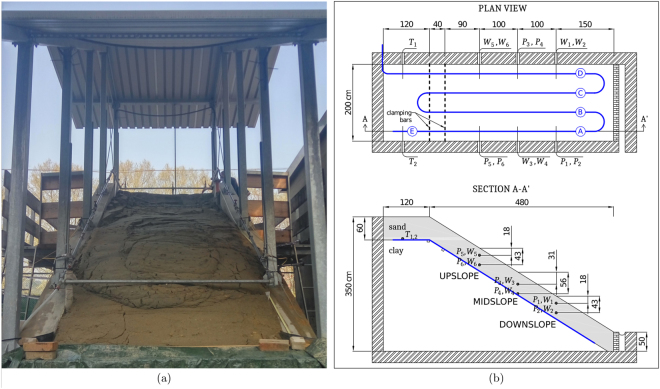
Figure 1.
(a) The andslide occurred during the test in the large-scale physical model. (b) Top and lateral view of the instrumented flume; vertical dashed lines in the top view correspond to the clamping bars. The meandering optical fibre cable is represented in blue. Capital letters A,B…E identify spans of the fibre under measurement; are pore water pressure sensors (i.e. tensiometers), and correspond to volumetric water content and temperature probes, respectively. The solid grey area in the lateral view represents the uniform fine sand layer; positions and depths of hydrological sensors, cable and bars are also indicated.

