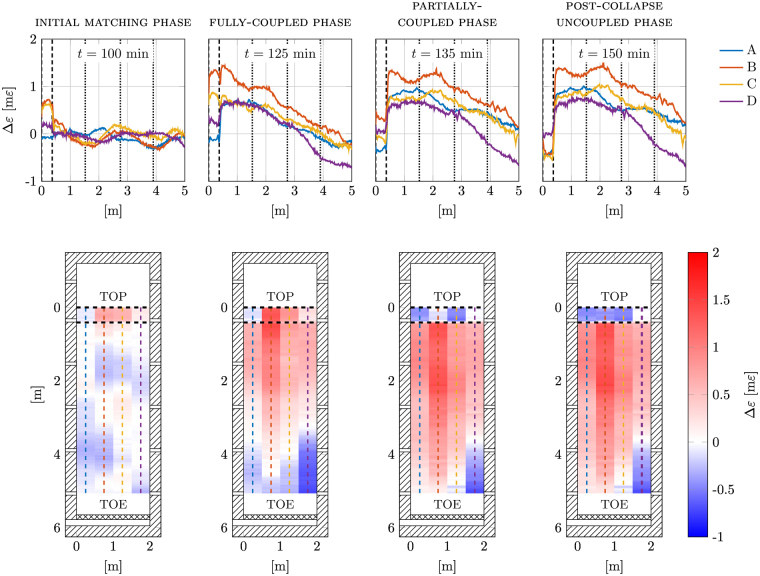
Figure 3.
Upper plots: strain field at the four cable spans, namely A, B, C and D, at t = 100 min, 120 min, 135 min and 150 min, corresponding to the different regimes of landslide evolution. A dashed vertical line represents the lower clamping bar position. Vertical dotted lines identify up-, mid- and downslope sections where the PWP and VWC sensors are located. Lower plots: corresponding colour maps of the strain field taken at the same instants.

