Figure 2.
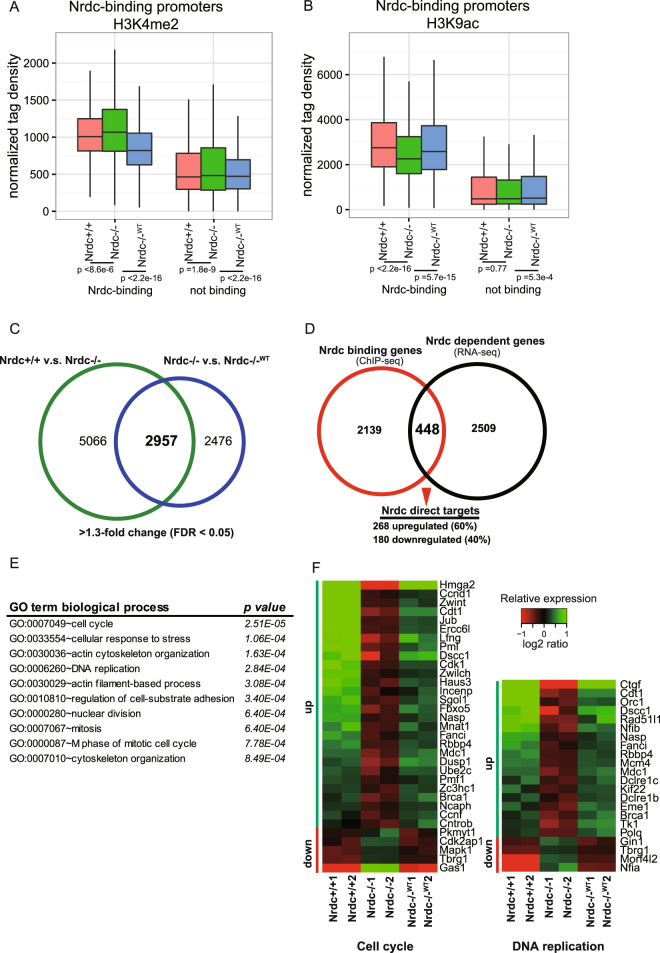
Nrdc affects the acetylation and methylation of histone H3 and gene transcription. (A,B) Average signals of H3K4me2 (A) and H3K9ac (B) from −5 kb to+5 kb surrounding the 2587 Nrdc-binding and other non-binding promoters in Nrdc+/+, Nrdc−/−, and Nrdc−/−WT iMEF, which were normalized to total reads and read lengths. (C) Venn diagram showing the overlap of genes that were up- or down-regulated 1.3-fold or more in the same direction in the Nrdc+/+ v.s. Nrdc−/− group and Nrdc−/−WT v.s. Nrdc−/− group. (D) Overlap between all Nrdc-binding genes and genes differentially expressed in an Nrdc-dependent manner, which identified a set of 448 Nrdc direct targets, with 268 being up-regulated and 180 being down-regulated. (E) Biological process GO terms enriched in the list of Nrdc direct target genes. P values are calculated by DAVID using a modified Fisher exact test22. (F) Heatmap showing the expression of genes within the categories of the cell cycle and DNA replication in Nrdc+/+, Nrdc−/−, and Nrdc−/−WT iMEF. The color key indicates log2 transformed and mean-centered rpkm of genes. The color bars indicate the direction of either significantly up-regulated (green) or down-regulated (red) change in corresponding genes (FDR < 0.05 and fold change > 1.3).

