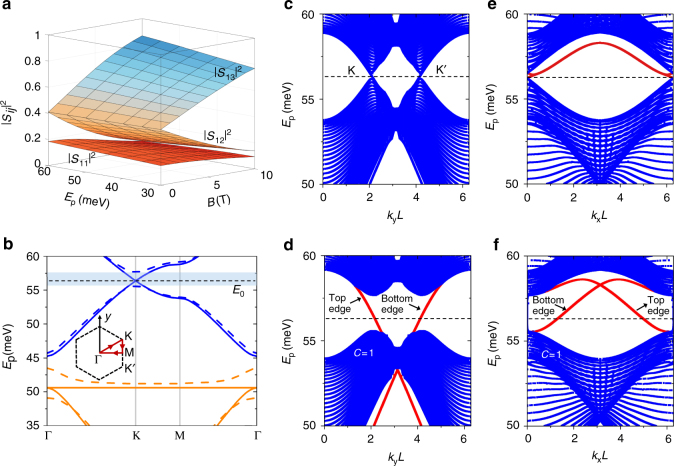
Fig. 2.
Plasmon band diagrams of the graphene superlattice. a Squared amplitude of the junction scattering coefficients (see Fig. 1c) as a function of plasmon energy and magnetic-field strength B for the same ribbon parameters as in Fig. 1d. b Plasmon band diagram along an excursion within the first Brillion zone of the superlattice for B = 0 (solid curves) and B = 4 T (dashed curves). c–f Projected band diagram calculated for a superlattice of finite period (N = 20) along the zig-zag (y direction in Fig. 1a) (c, d) and armchair (x direction in Fig. 1a) (e, f) boundaries with B = 0 (c, e) and B = 4 T (d, f). The red curves indicate the edge modes on the upper and bottom boundaries. We numerically calculate a Chern number C = 1 for the band below the gap with B = 4 T. The superlattice hexagon side length is L = 600 nm (see Fig. 1a), while other ribbon parameters are the same as in Fig. 1b (width W = 200 nm, Fermi energy E F = 0.2 eV)

