Figure 2.
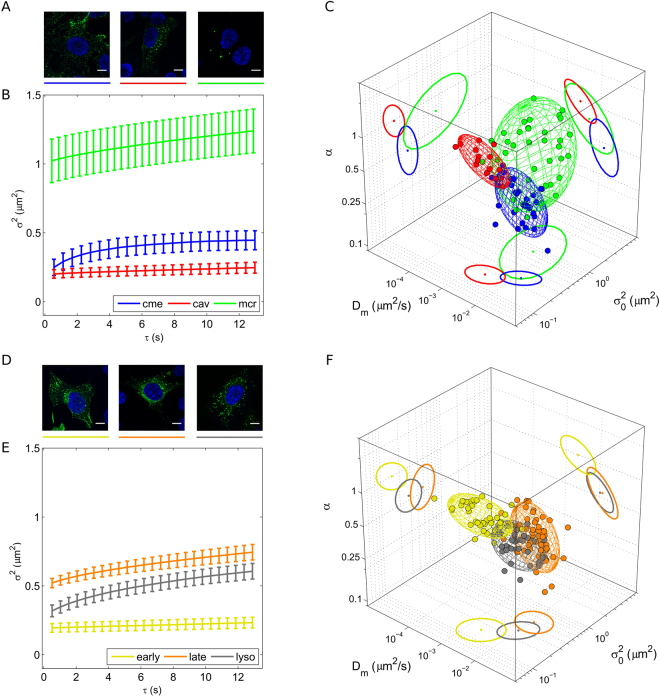
Dynamic fingerprint of exemplary intracellular nanostructures. (A) Representative confocal images of clathrin-coated vesicles, macropinosomes, and caveolae, respectively (green signals). The blue signal indicates the nucleus. Scale bar: 10 µm. (B) Representative iMSD plots of the three structures with error bars (clathrin-coated vesicles in blue, macropinosomes in green, and caveolae in red). (C) 3D plot of extracted parameters shows the differences in the dynamic (short-range diffusivity and anomalous coefficient) and structural (size) properties of the selected structures. (D) Representative confocal images of early endosomes, late endosomes, and lysosomes, respectively (green signals). Scale bar: 10 µm. (E) Representative iMSD plots of the three structures with error bars (early endosomes in dark yellow, late endosomes in orange, and lysosomes in grey). (F) 3D plot of extracted parameters shows the differences in the dynamic and structural properties of the selected structures.

