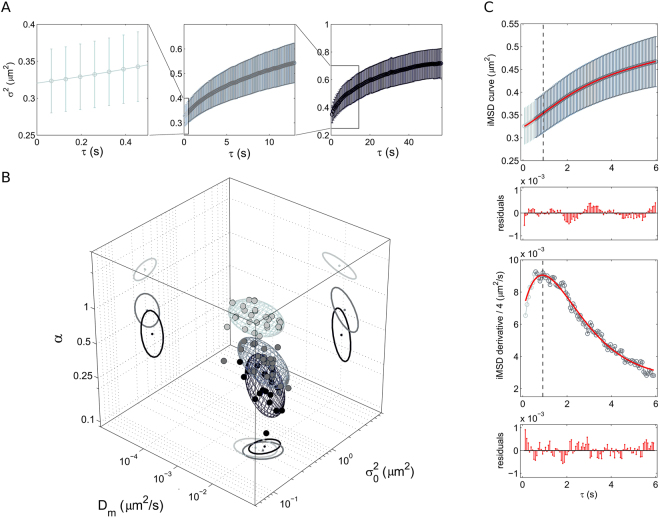
Figure 3.
Dynamic fingerprint of the lysosome at different spatiotemporal scales. (A) Exemplary iMSD plots of the lysosome at three different temporal scales: short, 0–0.5 seconds (left, light grey); intermediate, 0–12 seconds (middle, grey); long, 0–60 seconds (right, dark grey). (B) 3D plot of the dynamic fingerprint of the lysosome at the three different temporal scales. (C) The first 6 seconds of the iMSD plot are reported here (upper panel) to show the goodness of the fit to the global model (red line and residuals, Eq. 6 in Materials and Methods). The derivative of the iMSD plot shows the trend of the measured diffusivity (lower panel).

