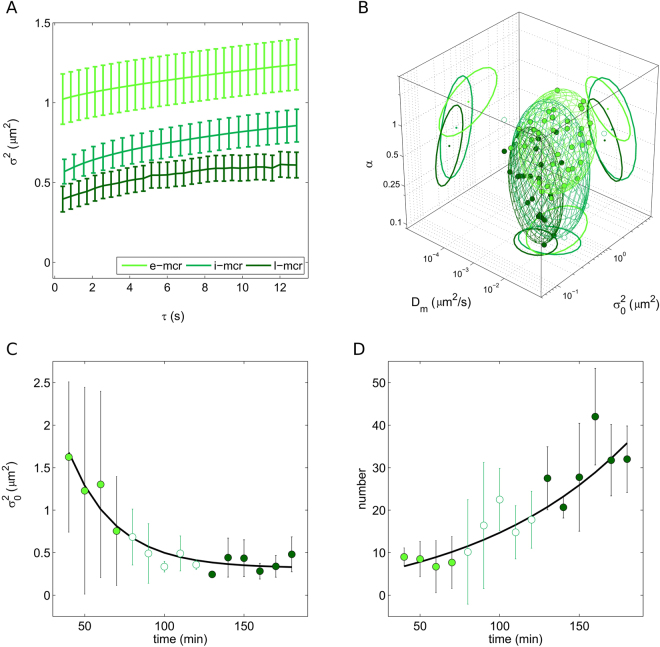
Figure 4.
The time evolution of the macropinosome dynamic fingerprint. (A) Exemplary iMSD plots of macropinosomes at three different stages of trafficking: early (30–70 min), intermediate (80–120 min), and late (>130 min). (B) 3D plot showing the time evolution of the dynamic fingerprint of macropinosomes from early (light green) to intermediate (white) and finally late (dark green) stages of trafficking. (C) Statistics on the average size (offset, σ2) of macropinosomes observed at the different time points. (D) Statistics on the average number (N) of macropinosomes observed at the different time points.

