Fig. 6.
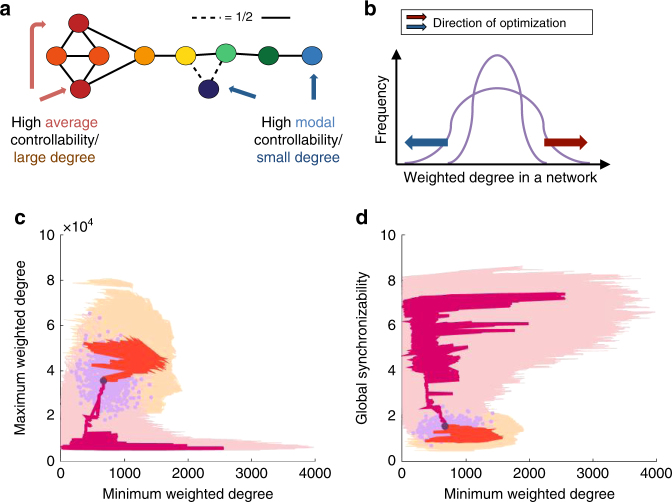
Specificity of controllability vs. degree. a As average (modal) controllability of each node is closely tied to high (low) weighted degree of that node10, we repeat our optimization for maximum and minimum weighted degree in the network. b While the edge weight distribution of the network remains the same, edge swaps can alter the total degree of each node to increase the minimum (blue arrow) or maximum (red arrow) degree of the nodes. c, d The maximum and minimum weighted degree of each subject’s brain network are plotted as purple dots c and similarly for minimum weighted degree and synchronizability d—we see little structure or discernible relationship between individuals. We also plot representative optimization trajectories for each subject in the forward direction (yellow) in the cross section of increasing maximum weighted degree and decreasing minimum weighted degree c and decreasing minimum weighted degree and synchronizabililty d; as well as trajectories in the opposite direction (pink). The trajectory for a single representative individual is highlighted, for both forward (red) and backward (dark red) directions. We observe that this example trajectory takes a meandering path through the plane, displaying little structure

