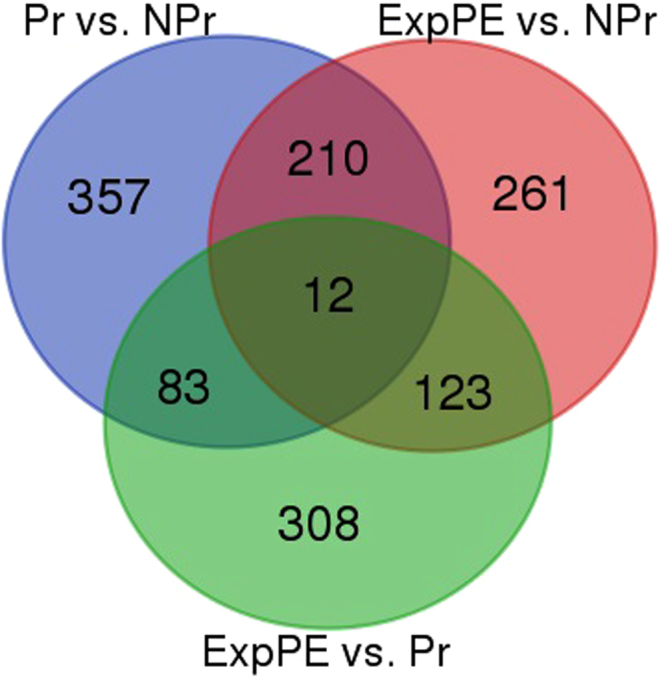
Figure 1.

Venn diagram of aortic gene expression, representing three sets of genes which are differential expressed between the groups. The top left circle contains the differential expressed genes between healthy Pregnant (Pr; n = 5) and Non-Pregnant (NPr; n = 4) animals, the top right circle contains the differential expressed genes between Experimental Preeclamptic (ExpPE; n = 5) and NPr animals, and the bottom circle contains the differential expressed genes between ExpPE and Pr. p < 0.05, fold change <−1.4 or >1.4.
