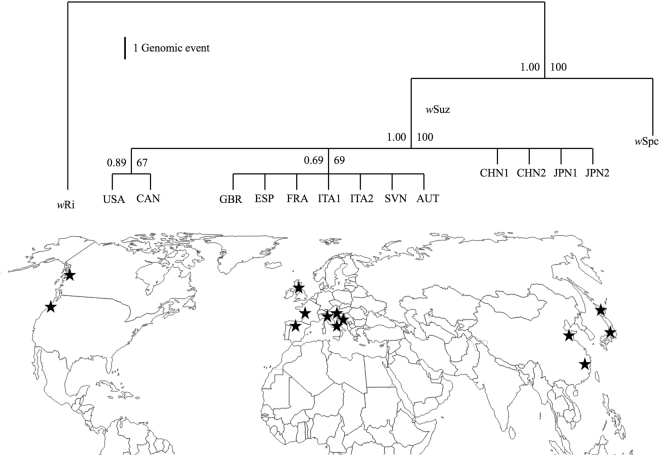
Figure 4.
Phylogeny from all polymorphic loci. Cladogram of wRi, wSpc and wSuz Wolbachia strains inferred from the 34 character- state matrix. Support values for each node are placed, on the left is the Bayesian posterior probability and right is the percentage bootstrap support from TNT based parsimony analysis. Black stars on the map represent each sampled population of D. suzukii used in this study. The map was modified from d-maps.com (http://d-maps.com/m/world/centreeurope/centreeurope22.gif).

