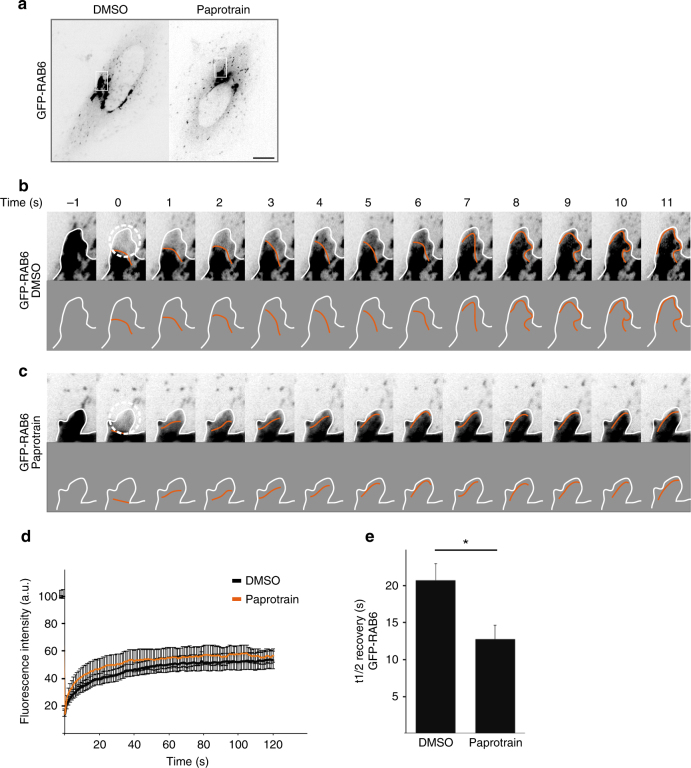
Fig. 5.
GFP-RAB6 diffuses on Golgi membranes and KIF20A inhibition affects the diffusion of GFP-RAB6. a Images of GFP-RAB6 expressing cells treated with DMSO or with paprotrain for 30 min. HeLa cells expressing GFP-RAB6 were bleached in a 30 pixels circular region of the Golgi apparatus (white circle) and then imaged for 2 min by spinning disk microscopy. Sequence of images of GFP-RAB6 in Golgi of a control cell (b) and a paprotrain-treated cell (c) before and after photobleaching. The round region delimited by a dotted line was photobleached immediately after the first image (−1). In both cases, images are displayed at the top and schematics of the images at the bottom. The orange line represents the recovery of the GFP-RAB6 fluorescence. In b, the photobleached area rapidly recovered fluorescence. The fluorescence flows from the center of the Golgi to the extremity of the bleached area. In c, the photobleached area recovered fluorescence twice faster than in b (compare t5). d The fluorescence recovery after photobleaching was measured in three independent experiments and plotted for GFP-RAB6 treated with DMSO (black) or with paprotrain (orange) (n = 17–19 Golgi). e Half-life recovery of GFP-RAB6 fluorescence in control cells and cells treated with paprotrain (mean ± SEM, n = 17–19 cells). *P = 0.01 (Student’s t test)

