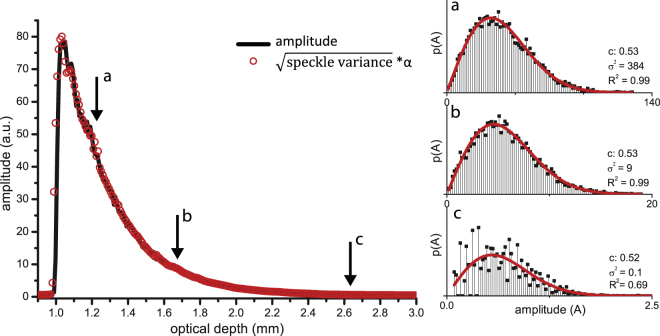
Figure 6.
Left panel: square root of the amplitude variance from within a ROI window of 0.08 mm in depth, ~3mm in width, moved in depth (red circles) and mean amplitude of the OCT signal (black line) of sample A. A single scaling factor (𝛼) is used to scale the square root of the amplitude variance to the mean amplitude. Panels on the right side shows the histograms of the amplitude distributions within the ROI from points a-c as indicated with arrows in the left panel. The amplitude distributions are fitted with a Rayleigh distribution (equation (3)), giving the reported contrast, speckle variance and R2 of the fits. The amplitude stays Rayleigh distributed when the ROI is moved in depth, until regions of very low SNR are reached (point c).

