Figure 6.
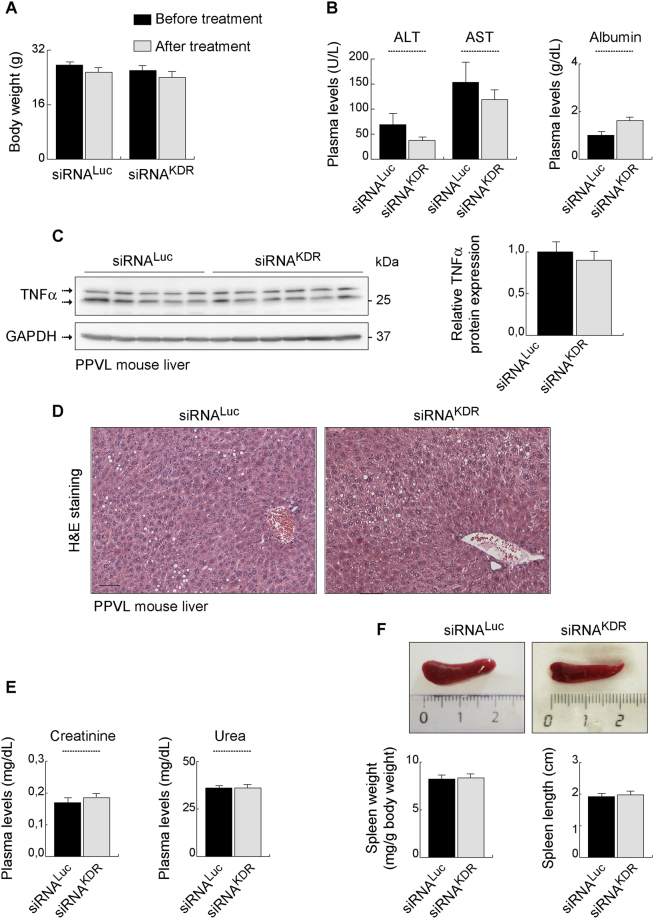
Lack of adverse effects after siRNAKDR-lipoplex treatment in mice. (A) Body weight (grams; mean ± SEM) in portal hypertensive mice, before and after treatment with siRNAKDR- and siRNALuc-lipoplexes. (B) Plasma levels of alanine aminotransferase (ALT, U/L), aspartate aminotransferase (AST, U/L) and albumin (g/dL) in portal hypertensive mice treated with siRNAKDR- or siRNALuc lipoplexes. (C) Protein expression of the proinflammatory cytokine tumor necrosis factor-α (TNFα, determined by immunoblotting, in the liver of portal hypertensive mice treated with siRNAKDR- or siRNALuc lipoplexes. Densitometric quantification of protein expression (mean ± SEM) is also shown. Whole blots are shown in Supplementary Fig. S2D. (D) H&E staining in liver sections from portal hypertensive mice treated with siRNAKDR- or siRNALuc lipoplexes. (E) Plasma levels of creatinine (mg/dL) and urea (mg/dL) in portal hypertensive mice treated with siRNAKDR- or siRNALuc lipoplexes. (F) Spleen weight (mg/g body weight) and spleen length (cm) in portal hypertensive mice treated with siRNAKDR- or siRNALuc lipoplexes. Macroscopic photographs of representative spleens are also shown. All results are presented as mean ± SEM.

